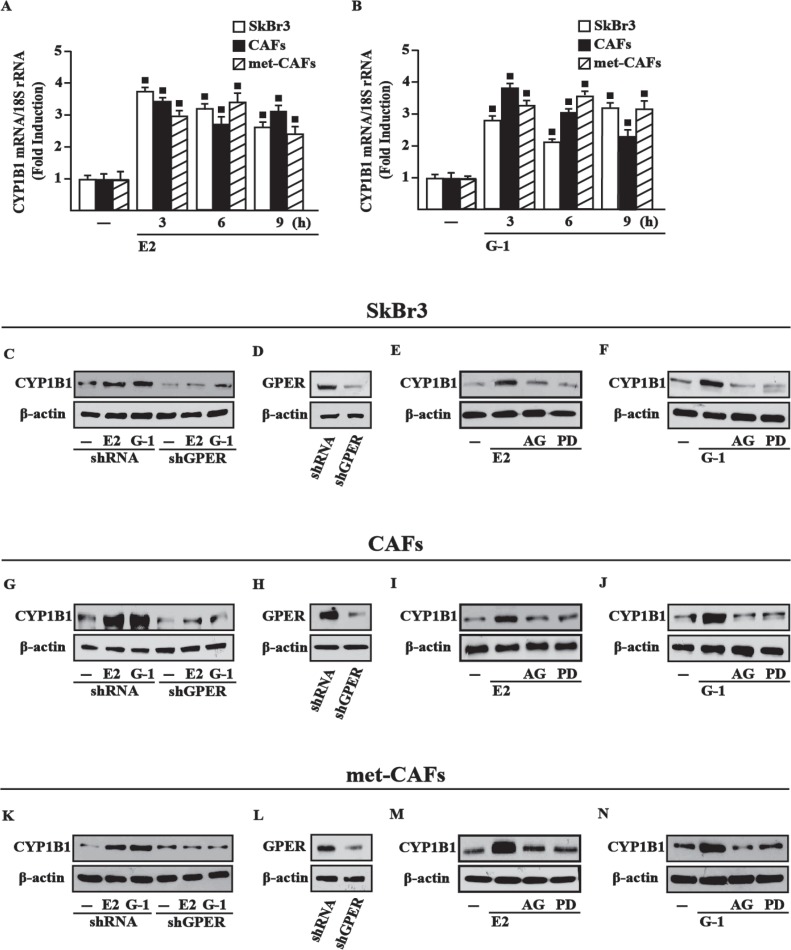
Figure 1. GPER mediates CYP1B1 induction by E2 and G-1 in SkBr3 cells, CAFs and met-CAFs.
E2 (10 nM) (A) and G-1 (100 nM) (B) induce the mRNA expression of CYP1B1, as indicated. Data obtained by real-time PCR in three independent experiments performed in triplicate were normalized to 18S expression and shown as fold changes of CYP1B1 expression upon treatments with E2 and G-1 respect to cells treated with vehicle (−). (■) P < 0.05 for cells receiving treatments versus vehicle. The up-regulation of CYP1B1 protein levels induced by 10 nM E2 and 100 nM G-1 is abrogated in SkBr3 cells (C), CAFs (G) and met-CAFs (K) transfected for 24 h with shRNA or shGPER and then treated for 6 h with vehicle (−), 10 nM E2 and 100 nM G-1. (D, H, L) Efficacy of GPER silencing. Evaluation of CYP1B1 protein levels in SkBR3 cells (E–F), CAFs (I–J) and met-CAFs (M–N) upon treatment for 6 h with vehicle, 10 nM E2 and 100 nM G-1 alone or in combination with 1 μM EGFR inhibitor AG1478 (AG) or 10 μM MEK inhibitor PD98059 (PD). β-actin serves as a loading control. Results shown are representative of at least two independent experiments.

