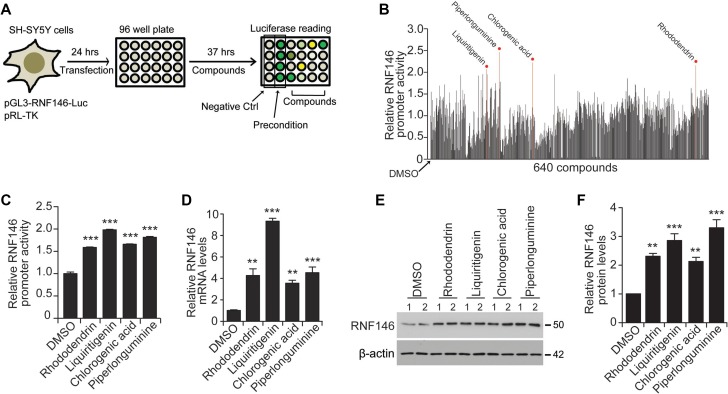
Figure 3. Screen for RNF146-inducing natural compounds.
(A) Schematic summary of the high-throughput natural compound (library of 640 individual compounds) screen. The screen employed a dual luciferase assay in SH-SY5Y cells transfected with the RNF146 promoter luciferase construct and pRL-TK. DMSO treatment and H2O2 preconditioning were used as negative and positive controls, respectively. (B) Relative RNF146 promoter activities in SH-SY5Y cells transfected with pGL3-RNF146-Luc and pRL-TK and then treated with the 640 natural compounds. Activities were determined by the luciferase assay. Firefly luciferase activity was normalized to that of Renilla luciferase. The normalized luciferase values are expressed relative to that of the DMSO negative control. Top four compounds that activated RNF146 promoter are indicated. (C) Quantification of relative RNF146 promoter activities in SH-SY5Y cells transfected with pGL3-RNF146-Luc and pRL-TK for 24 hrs, followed by 37 hrs treatment with 10 uM of the following RNF146-inducing compounds: rhododendrin, liquiritigenin, chlorogenic acid, and piperlonguminine (n = 6). (D) Quantification of relative RNF146 messenger RNA levels normalized to that of GAPDH in SH-SY5Y cells treated for 37 hrs with 10 uM of the following RNF146-inducing compounds: rhododendrin, liquiritigenin, chlorogenic acid, and piperlonguminine (n = 3). (E) Representative western blots showing RNF146 expression in SH-SY5Y cells treated for 37 hrs with the indicated compounds. β-actin serves as a loading control. (F) Quantification of relative RNF146 protein levels normalized to that of β-actin in SH-SY5Y cells treated for 37 hrs with 10 uM of the following RNF146-inducing compounds: rhododendrin, liquiritigenin, chlorogenic acid, and piperlonguminine (n = 3). Data are expressed as mean ± SEM. **P < 0.01 and ***P < 0.001, ANOVA test followed by Tukey post hoc analysis.

