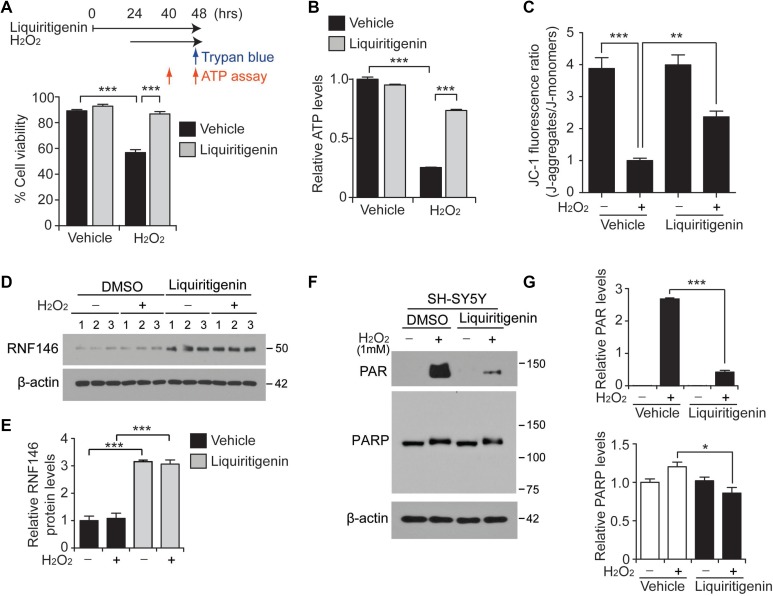
Figure 5. Liquiritigenin protects SH-SY5Y cells from oxidative stress via RNF146 expression and PARP1 inhibition.
(A) Trypan blue exclusion viability assay in SH-SY5Y cells demonstrating the protective effect of liquiritigenin (10 uM, 48 hrs) against H2O2 (1 mM, 24 hrs)-induced cell death (n = 6). The upper panel scheme summarizes the experimental design for the trypan blue cell viability assay and the ATP assessment. (B) Assessment of relative intracellular ATP levels in SH-SY5Y cells challenged with H2O2 (1 mM, 16 hrs) following pretreatment with liquiritigenin (10 uM, 40 hrs) or DMSO vehicle as a control (n = 6). (C) Assessment of mitochondrial membrane potential using JC-1 fluorescent dye in SH-SY5Y cells challenged with H2O2 (1 mM, 16 hrs) following pretreatment with liquiritigenin (10 uM, 37 hrs) or DMSO as a control (n = 7). (D) Representative immunoblots showing RNF146 expression levels in SH-SY5Y cells challenged with H2O2 (1mM, 24 hrs) following pretreatment with liquiritigenin (10 uM, 48 hrs) or DMSO vehicle as a control. (E) Quantification of relative RNF146 expression levels in the experimental groups in panel d. Values are normalized to those of β-actin (n = 3). (F) Representative immunoblots showing poly (ADP-ribose) (PAR) expression levels in SH-SY5Y cells challenged with H2O2 (1 mM, 15 min) following pretreatment with liquiritigenin (10 uM, 24 hrs) or DMSO vehicle as a control. (G) Quantification of relative PAR and PARP expression levels in the experimental groups in panel C. Values are normalized to those of β-actin (n = 3). Data are expressed as mean ± SEM. *P < 0.05, **P < 0.01, and ***P < 0.001, ANOVA test followed by Tukey post hoc analysis.

