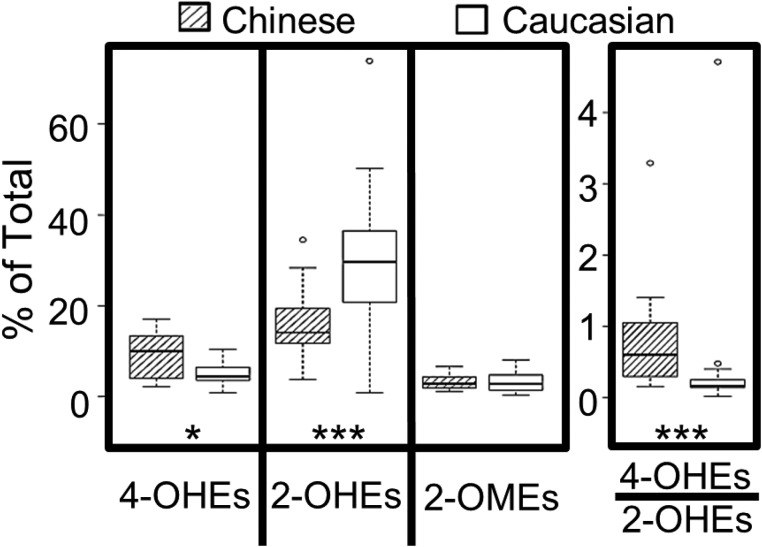
Figure 4. Level of urinary catechol estrogens (% total estrogens and estrogen metabolites) in healthy postmenopausal Chinese (n = 20) vs. Caucasian (n = 19) American women who never smoked.
The box plots denote the median and the 25th and 75th percentiles (inter-quartile range, IQR). The “whiskers” represent the most extreme points (≤ 1.5 times the IQR). Outliers are outside the boxes. P values are based on the Wilcoxon rank sum test (*P < 0.05; ***P < 0.001).

