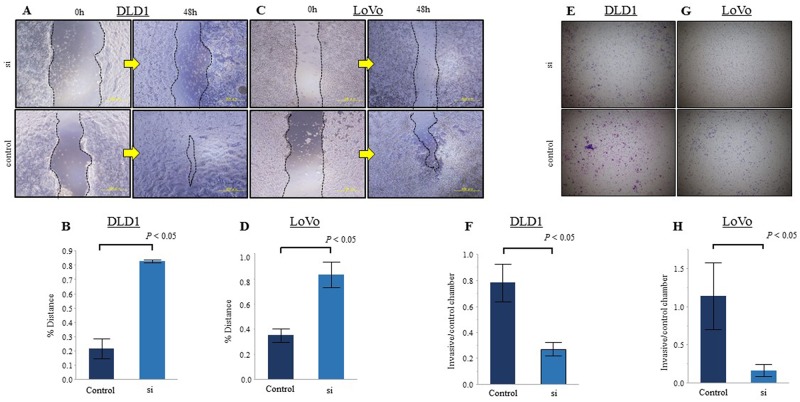
Figure 4. Reduction of ezrin expression inhibits CRC cell migration and invasion in vitro.
(A, C) Wound healing assays of DLD1 (A) and LoVo (C) CRC cells transfected with control or ezrin-specific siRNA. Representative images were acquired at 0 h and 48 h after wounding. (B, D) Quantitation of migration in the assays represented in A and C. The y-axis represents migration rates relative to control cells. (E, G) Transwell invasion assays of DLD1 (E) and LoVo (G) cells transfected with control or ezrin-specific siRNA. Phase contrast micrographs at ×40 magnification. (F, H) Quantitation of invasion in the assays represented in E and G. The y-axis represents the ratio of the number of invading cells per control chamber cells. All assays were replicated and the results are presented as the mean ± SEM.

