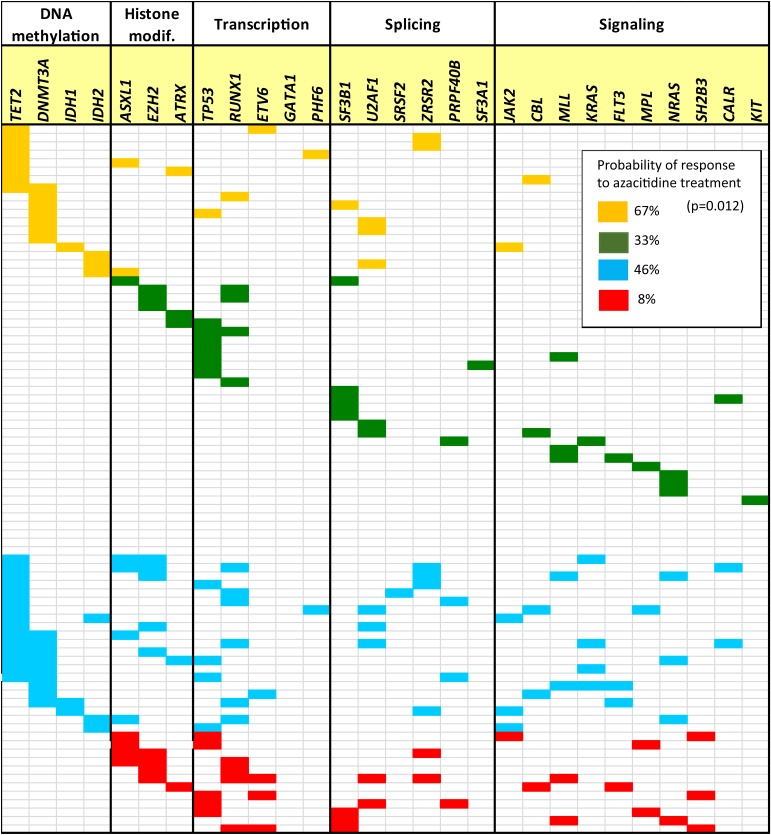
Figure 1. Spectrum of mutations in the 84 patients with myelodysplastic syndrome (MDS) (where each row represents a single patient).
Only 28 genes are shown, the remainder of genes analyzed did not present mutations in this cohort of patients (SF1, VHL, KDM6A, PTEN, HRAS, and EPOR). Yellow (group 1): total number of mutations per patient ≤2 and at least ≥1 mutation per patient in DNA methylation pathway; Green (group 2): total number of mutations per patient ≤2, and 0 mutations per patient in DNA methylation genes; Blue (group 3): total number of mutations per patient >2 and at least ≥1 mutation per patient in DNA methylation pathway; and Red (group 4): total number of mutations per patient >2, and 0 mutations per patient in DNA methylation pathway.

