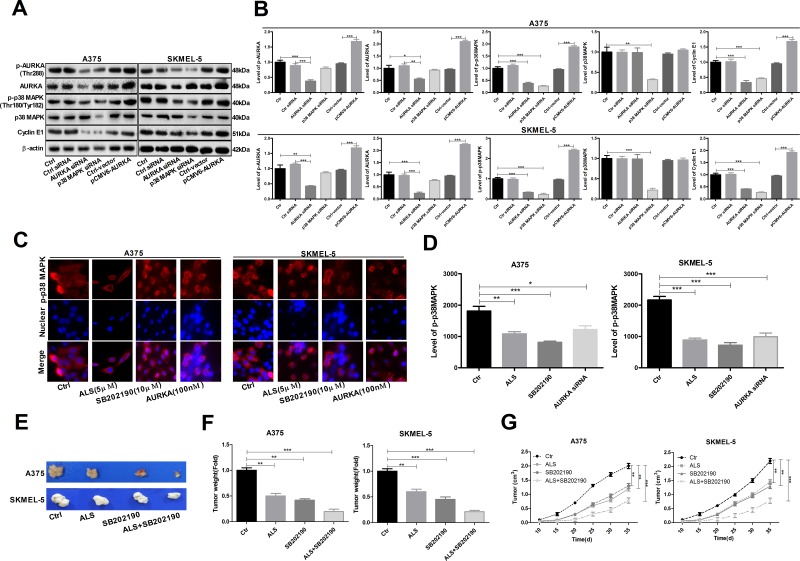
Figure 7. AURKA-stimulated upregulation of p-p38 MAPK levels in A375 and skmel-5 cells.
(A) Western blot analysis of p38 MAPK signaling pathway components in A375 and skmel-5 cells; (B) Quantification of the relative protein levels; (C) Immunofluorescence analysis of p-p38 MAPK levels in A375 and skmel-5 cells; (D) Quantification of the relative immunofluorescence intensities; (E) Images of tumor cell morphology in the different treatment groups; (F) Tumor weights in the different treatment groups; (G) Tumor growth curves. Data are expressed as the means ± SD. All experiments were repeated at least three times. (*p < 0.05, **p < 0.01, ***p < 0.001).

