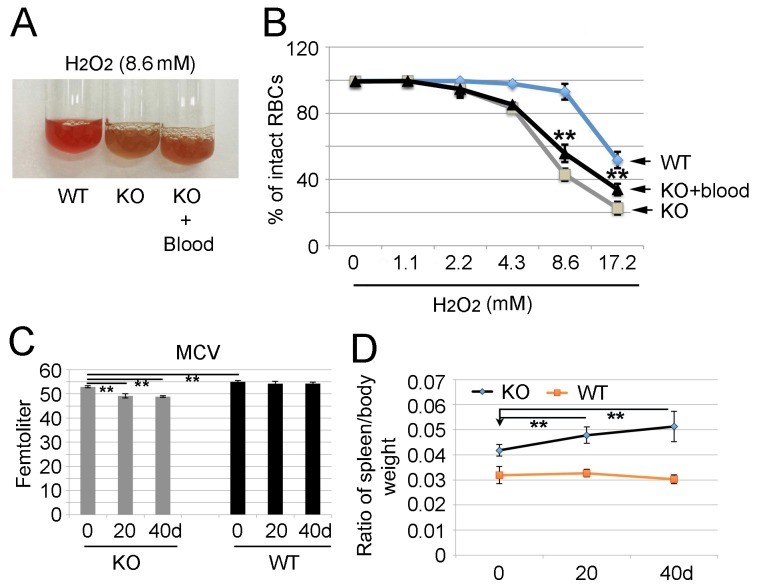
Figure 6. Change of anemic phenotypes of miR-144/451 KO mice after feeding with wild type blood or special chow diet containing much less miR-451.
(A) Hydrogen peroxide (H2O2)-induced color change of miR-144/451 KO blood with and without feeding with WT blood. WT and miR-144/451 KO blood were used as both negative and positive controls. Note: the color of miR-144/451 KO blood turned to brown upon exposure to H2O2 (middle tube), however the color of blood from miR-144/451 KO mice with feeding WT blood was somewhat between red and brown (right tube), suggesting less hemolysis with WT blood feeding. (B) Flow cytometric analysis of fractions of intact erythrocytes in miR-144/451 KO mice after treatment with various concentrations of H2O2. WT blood (light blue line) was used as a control which contained much more intact erythrocytes after treatment with H2O2. Note: blood from miR-144/451 KO mice fed with WT blood contain significantly increased numbers of intact erythrocytes (black line) compared with the miR-144/451 KO blood without WT blood feeding (grey line). Five mice from each group were analyzed. **p < 0.01 (t-test). (C) Measurement of mean corpuscular volume (MCV) in miR-144/451 KO mice 20 and 40 days after feeding with special chow diet. WT animals were used as control. Note: there is a significant decrease of MCV in miR-144/451 KO blood cells compared with those in WT animals (at 0 day), and the MCV was even lower in miR-144/451 KO mice fed with special chow diet. **p < 0.01 (t-test). (D) Spleen size in miR-144/451 KO mice fed with special chow diet. The Y-axis shows the ratio of spleen to body weight. The weight of WT spleens was used as normal control. n = 6 for each group. ** p < 0.01 (t-test). There is a significant increase of spleen/body weight of miR-144/451 KO mice fed with special chow diet compared to that of WT mice, indicating a potential compensated erythropoiesis.

