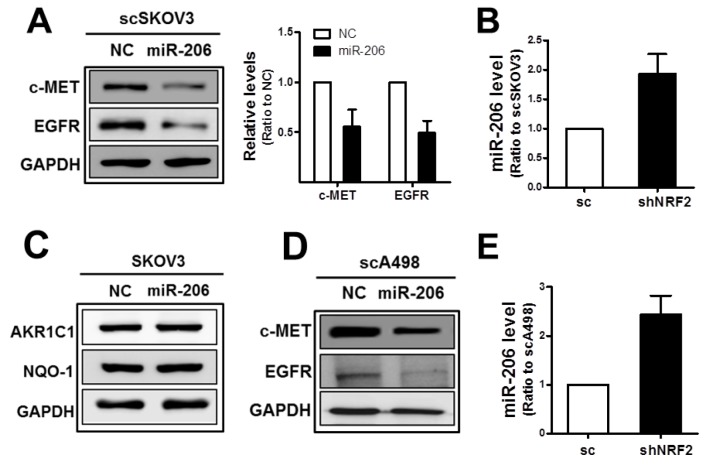
Figure 2. MiR-206 mimic treatment represses c-MET and EGFR levels.
(A) The scSKOV3 cells were transfected with miR-206 mimic (100 nM) or negative control (NC), and c-MET, EGFR and GAPDH protein levels were determined by Western blot. Quantified results are means ± SD from three independent experiments. (B) MiR-206 levels in the sc and shNRF2-SKOV3 were confirmed using relative real-time PCR analysis. Values are means ± SD from three experiments. (C) Protein levels for AKR1C1 and NQO-1 were assessed in miR-206 expressing SKOV3 cells. (D) c-MET, EGFR, and GAPDH protein levels were determined by Western blotting after transfection of scA498 cells with miR-206 mimic or negative control (NC). (E) MiR-206 levels in the sc and shNRF2-A498 cells were confirmed using relative real-time PCR analysis. Values are means ± SD from three experiments. Similar blots were obtained from three independent experiments (B, C, and D).

