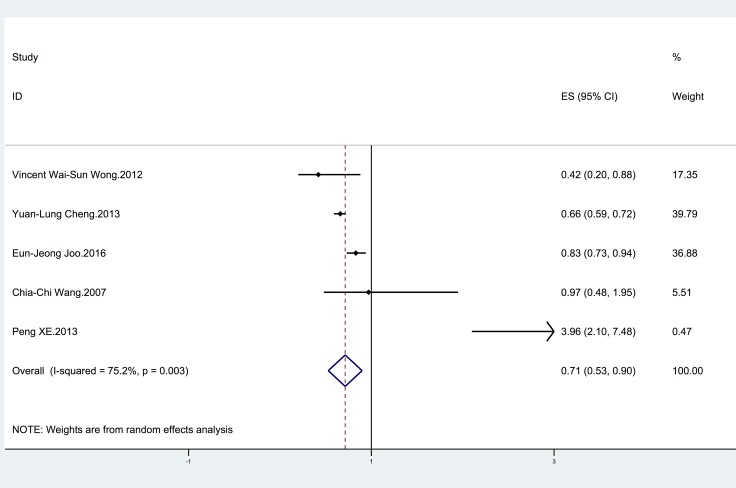
Figure 2. Forest plot showing the relationship between HBV infection and the risk of NAFLD.
The horizontal axis is the X axis. The points represent the risk estimate of each individual study. Horizontal lines represent 95% confidence intervals; diamonds represent the summary risk estimate with 95% confidence interval. HBV, hepatitis B virus. NAFLD, nonalcoholic fatty liver disease. CI, confidence interval. ES, effect size.

