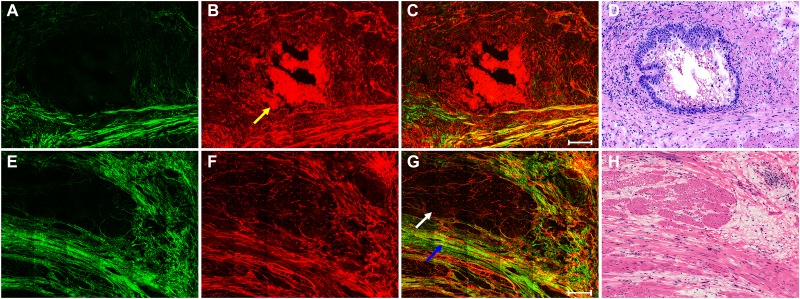
Figure 2. The top row shows the nonlinear optical images of tumor response to neoadjuvant therapy with fibrosis changes and corresponding H&E-stained image.
(A) SHG image; (B) TPEF image; (C) merging of SHG and TPEF images; and (D) H&E-stained image. The bottom row shows the nonlinear optical images of residual muscular tissues with predominant tumor regression and fibrosis after neoadjuvant therapy in rectal cancer and corresponding H&E-stained image: (E) SHG image; (F) TPEF image; (G) merging of SHG and TPEF images; and (H) H&E-stained image. White arrow: remaining muscle tissues; blue arrow: fibrosis; yellow arrow: dead cells. Scale bar: 100 μm.

