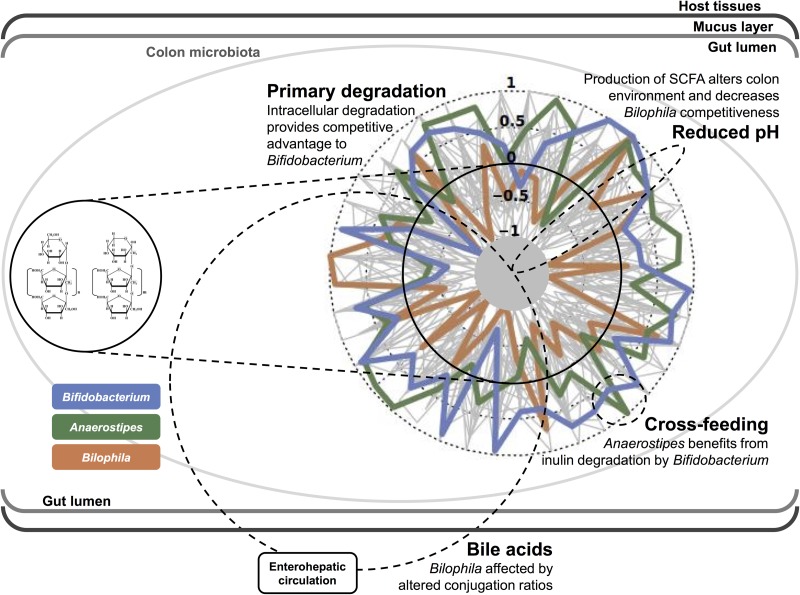
Figure 4.
Overview of inulin-induced compositional changes in the gut microbiota complemented with mechanistic hypotheses. Radar plot shows scaled variation in relative genus abundances (end riI vs end I) per individual, with decreased abundance of the genus over the inulin intervention situated within and increased abundance outside the solid circle (zero). Variation in abundances of genera identified as inulin-responsive are highlighted.

