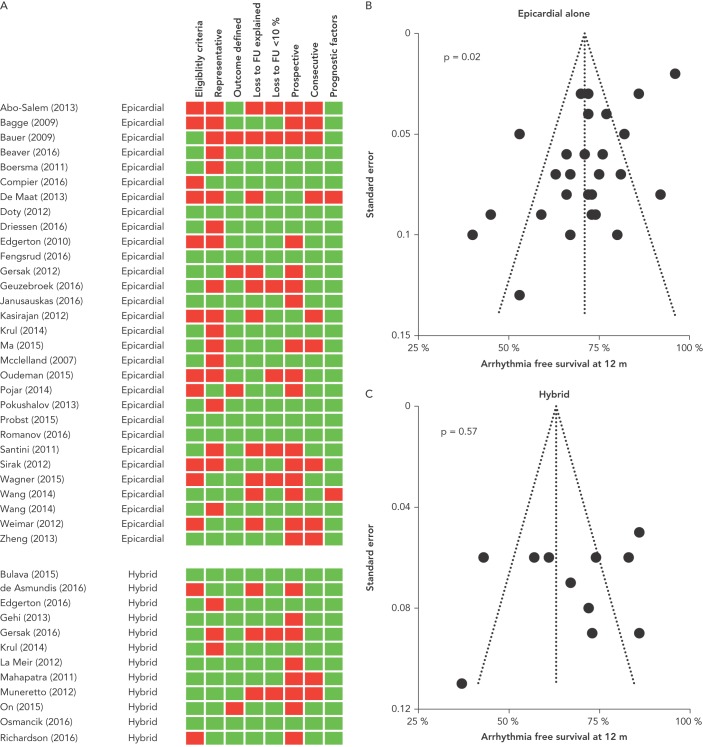
Figure 3: Assessment of Study Quality and Risk of Bias.
A: Study quality assessment. Green boxes indicate that this study passed this criterion and red boxes indicate failure. B: Funnel plot of studies of epicardial ablation alone. C: Funnel plot of studies of hybrid ablation. P-values refer to Egger’s test of likelihood of publication bias.

