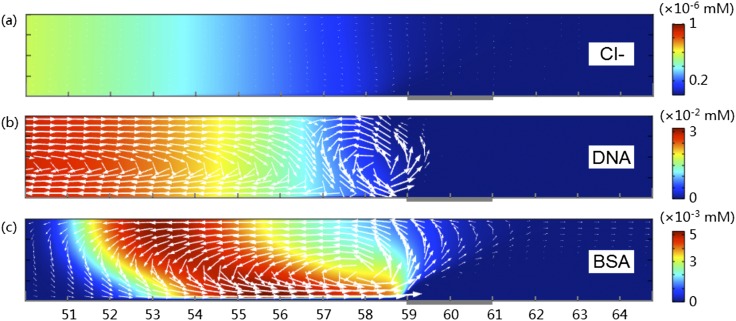
FIG. 8.
Fluxes of (a) Cl- in KCl solution, (b) DNA in KCl+DNA, and (c) BSA in KCl+BSA. The background colors show the concentration of respective species in their own scale. The lengths of the arrows are scaled by the tenth root of the magnitudes of their original fluxes densities. Only the lower half of the channel is plotted.

