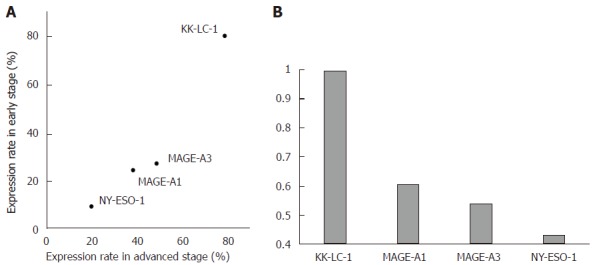
Figure 2.

Ratio of CTA expression between early and advanced stage gastric cancer. These figures show a comparison of expression rates of each CTA between early and advanced stage. A: Distribution of expression rate of each CTA in early and advanced stages; B: Early/advanced stage expression ratios (E/A ratios) were used to evaluate whether the CTAs concerned were frequently expressed in early- as well as advanced-stage samples. (E/A ratio = expression rate of early stage/expression rate of advanced stage).
