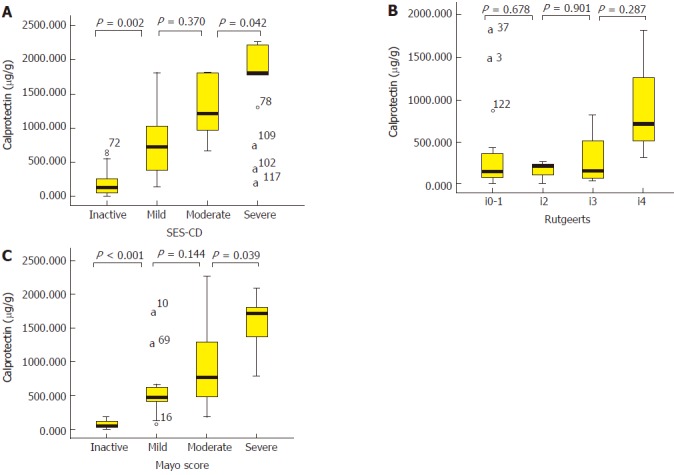
Figure 2.

Median fecal calprotectin levels according to endoscopic activity grade in three subgroups of inflammatory bowel disease patients, illustrated by box plots. A: The median FC levels in CICD patients grouped by SES-CD. B: The median FC levels in CD-related surgery patients grouped by Rutgeerts score. C: The median FC levels in UC patients grouped by Mayo score. a: the sample numbers of fecal calprotectin extreme values in box plots; FC: Fecal calprotectin; CD: Crohn’s disease; UC: Ulcerative colitis; CICD: Colonic or ileo-colonic Crohn’s disease; SES-CD: Simple endoscopic score for Crohn’s disease.
