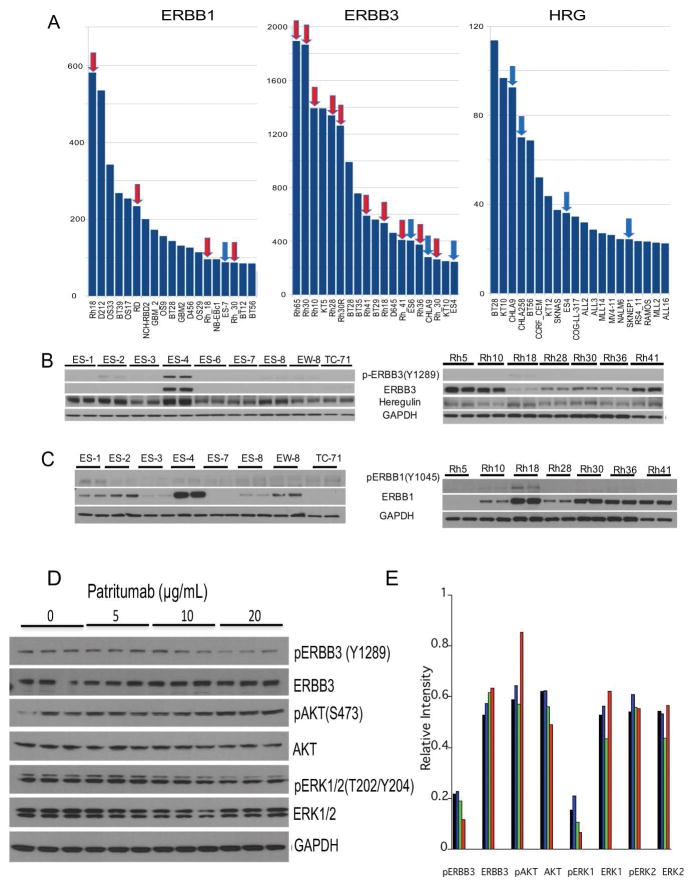
Figure 1.
Expression of ERBB1, ERBB3 and heregulin (HRG).
A, mRNA expression levels (Y axis, arbitrary units, Agilent Sureprint G3 array) showing the 20% highest expressing lines (19/96 PPTP models) for each gene. Data derived from xenograft tissue (e.g. designated Rh30) are distinguished from cell line derived expression data (e.g. designated Rh_30). Rhabdomyosarcomas (red arrows), Ewing sarcomas (blue arrows).
B, Western blot analysis of phospho-ERBB3, ERBB3 and HRG in Ewing sarcoma and rhabdomyosarcoma cell lines. GAPDH is used as a loading control.
C, Western blot analysis of phospho-ERBB1, and ERBB1 in Ewing sarcoma and rhabdomyosarcoma cell lines. GAPDH is used as a loading control.
D, ES-4 cells were exposed to increasing concentrations of patritumab for 24 Hr. Cells were harvested and lysates probed for phospho-ERBB3, ERBB3, phospho-AKT, AKT, phospho-ERK1/2, ERK1/2. GAPDH is used as a loading control.
E, Densitometric quantitation of western blot results in C. Bands were normalized to GAPDH. Control (black), patritumab 5 μg/mL (blue), 10 μg/mL (green), 20 μg/mL (red).

