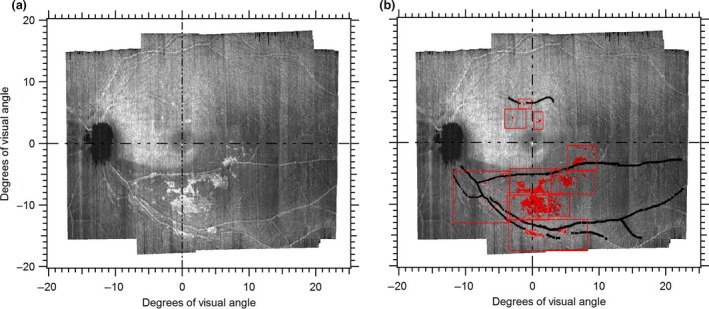
Figure 2.

Quantifying presumed activated retinal astrocytes and Müller cells (ARAM) on the en‐face images. (a) En‐face slab image extracted at 10–14 μm showing hyperreflective structures presumed to be ARAM. (b) Output of semi‐automated quantifying tool with regions of presumed ARAM identified in red. The red boxes show how the quantifying tool operated by a human observer first divides the image into sub‐regions to enhance localising the ARAM. The black lines identify regions of the blood vessels so that reflectances from the blood vessel walls are not erroneously quantified as ARAM.
