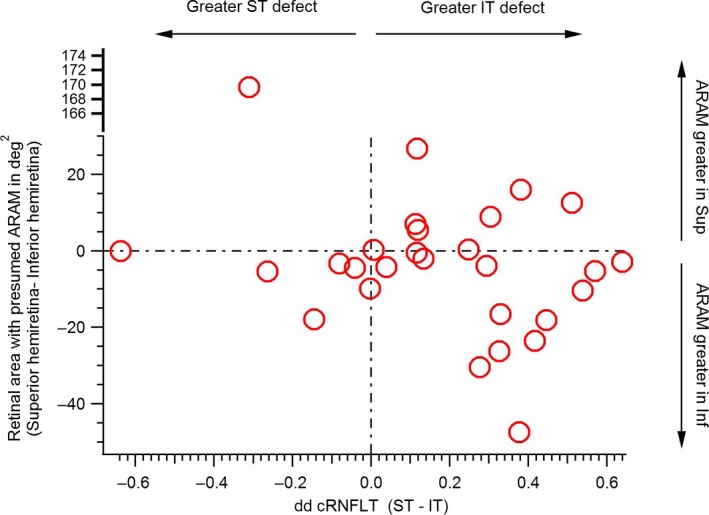
Figure 6.

Agreement between hemiretinal area with greatest extent of reflective structures presumed to be activated retinal astrocytes and Müller cells (ARAM), and disc sector with the greatest extent of glaucomatous abnormality. The Y‐axis shows the difference between the area of superior (Sup) hemiretina and inferior (Inf) hemiretina with presumed ARAM. The X‐axis shows the difference between the depth of defect (DD) between the superior temporal (ST) and inferior temporal (IT) circumpapillary retinal nerve fibre layer thickness measures (cRNFLT).
