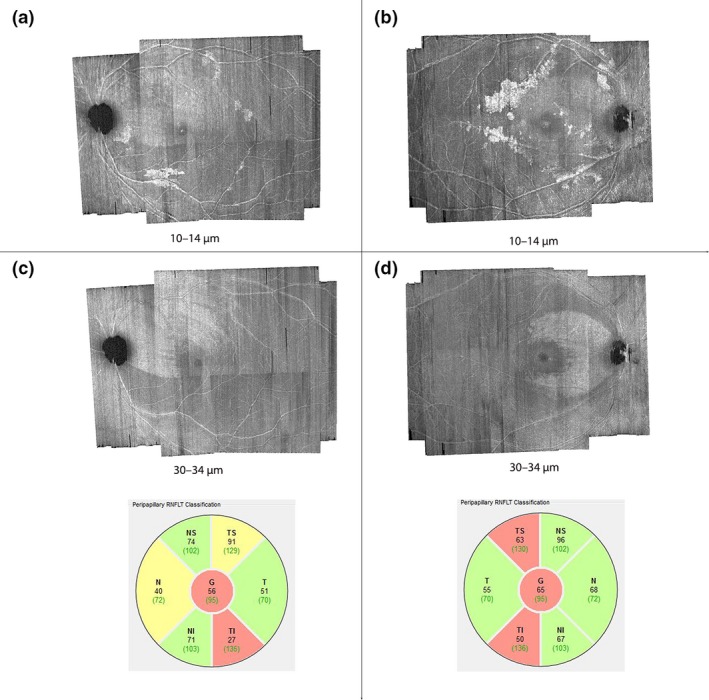
Figure 7.

Distribution of hyperreflective structures, presumed to be activated retinal astrocytes and Müller cells (ARAM), in regions of abnormal retinal nerve fibre bundle (RNFB) reflectance. The numbers labelling the figures are the axial depths from the inner limiting membrane at which the en‐face images were generated. (a) and (b) are examples of subjects in whom the distribution of the hyperreflective structures appear to be concentrated in the region of glaucomatous RNFB reflectance abnormality. (c) and (d) show the en‐face images at deeper depths distinctly showing the spatial location of RNFB reflectance abnormalities, and circumpapillary RNFB thickness profiles for the subjects in (a) and (b) respectively.
