
Fig. 2. Acquisition and analysis methods for measuring laminar fMRI activation patterns in the hand region of M1 induced by right hand finger tapping (with touch) in a single participant.
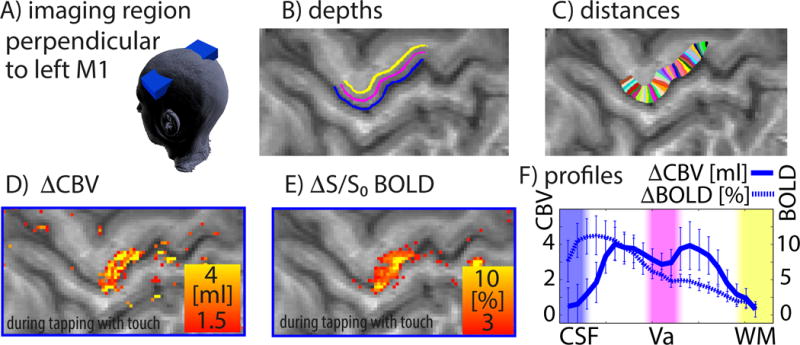
A) The imaging slice is aligned perpendicular to the cortical layers of the hand representation in the left motor cortex, and slices are tilted as indicated by the blue box. B–C) To analyze the high-resolution data, we use a cortical coordinate system of laminar structures and columnar structures. D) The CBV map reveals activity in superficial and deep cortical layers, while the BOLD map in E) shows strongest activity in superficial laminae only. Profiles in F) refer to the columnar structures between the black arrows in C). Error bars refer to standard deviations across 12 consecutive one-minute trials (see also Fig. S1–S3).