
Figure 4.
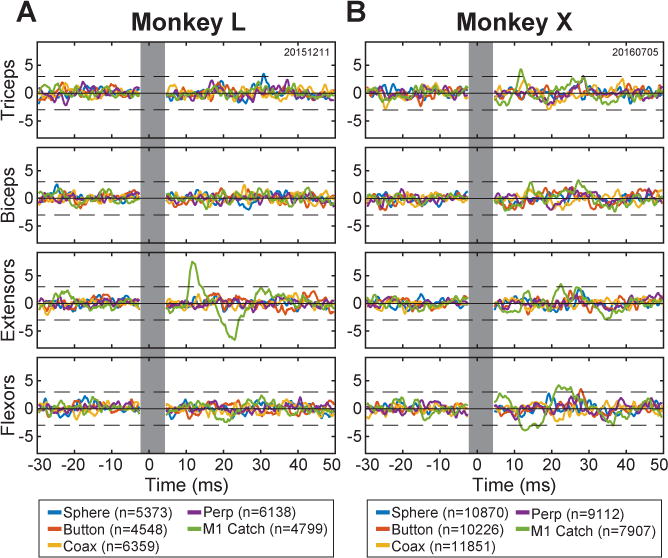
Stimulus-triggered averages of EMG activity. Averages of rectified EMG activity from four upper extremity muscle groups—Triceps, Biceps, forearm Extensors, and forearm Flexors—were compiled for each monkey (A, monkey L; B, monkey X) using individual ICMS pulses as triggers. ICMS parameters used for these sessions are given in Table S4. Separate averages (colors) were compiled using n pulses delivered through the PM electrode instructing the sphere, button, coaxial cylinder, or perpendicular cylinder, as well as for catch-trial pulses delivered in M1. The vertical gray bar indicates the interval during which the aligned stimulation artifacts have been blanked. Each trace has been z-scored. The dashed horizontal black lines represent ± 3 standard deviations from the bootstrap-adjusted baseline, i.e. the solid black horizontal line. See also Table S4 and Figure S1.