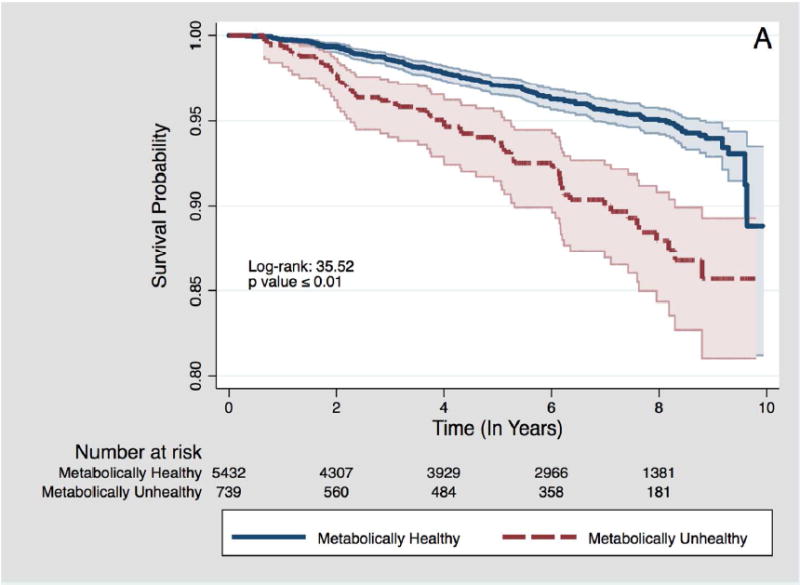
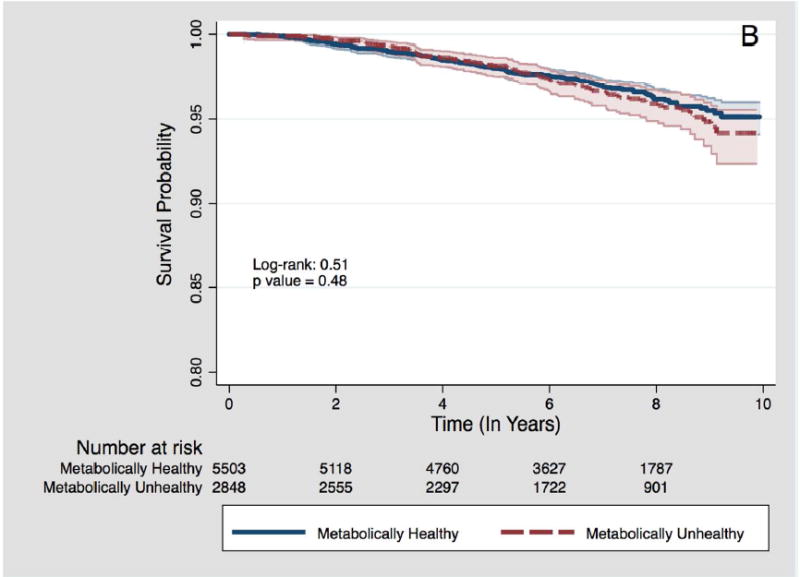
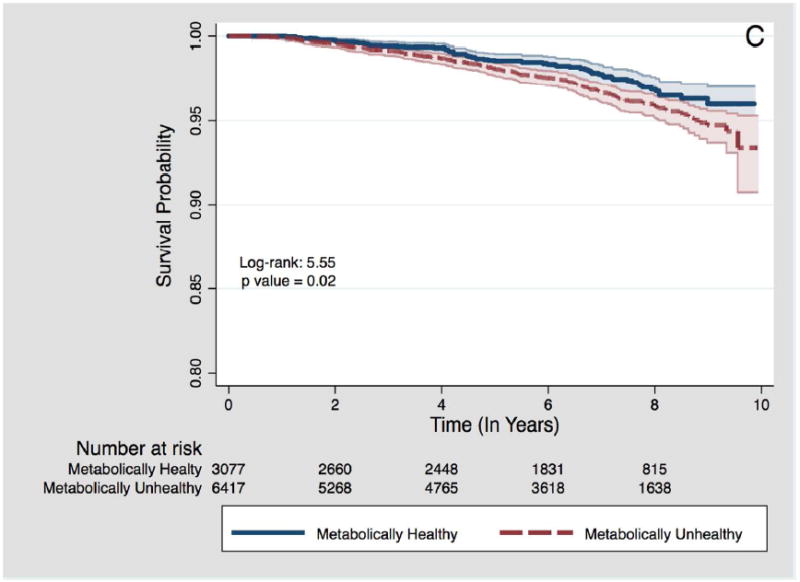
Figure 1.


Kaplan-Meier survival plots for time to cancer death by metabolic health status, stratified by BMI category.
A – Among participants with normal weight BMI category
B – Among participants with overweight BMI category
C – Among participants with obesity BMI category
