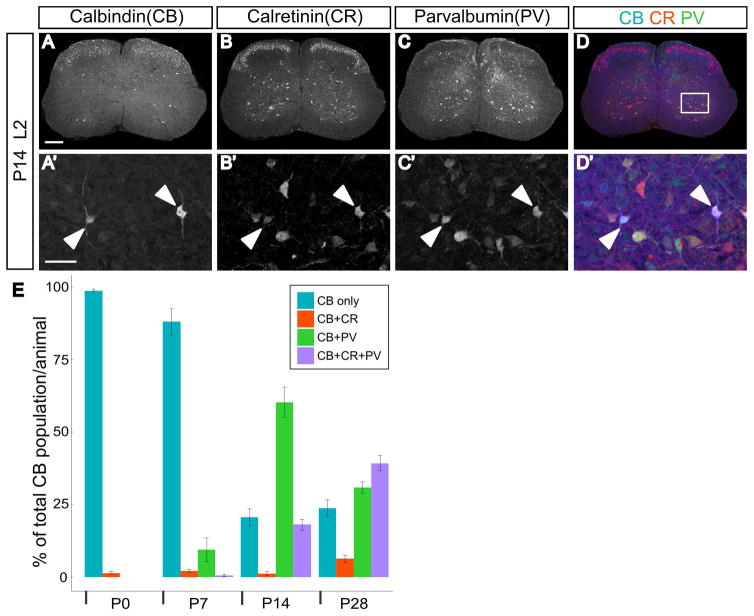
Fig. 2.
Coexpression of other calcium binding proteins in calbindin-expressing neurons increases during postnatal maturation. A–D: Representative transverse section from the L2 segment in a P14 animal showing expression of calbindin, calretinin, and parvalbumin. A′–D′: Enlarged view of region indicated by white box in D. Filled arrowheads point to CB, CR, and PV triple-positive cells. A–D scale bar=200μm and A′–D′ scale bar=50μm. E: Percentage of calbindin-expressing neurons also expressing calretinin and/or parvalbumin during postnatal development. Error bars indicate standard error of the mean (SEM), n=5 animals per age group.

