Fig. 5.

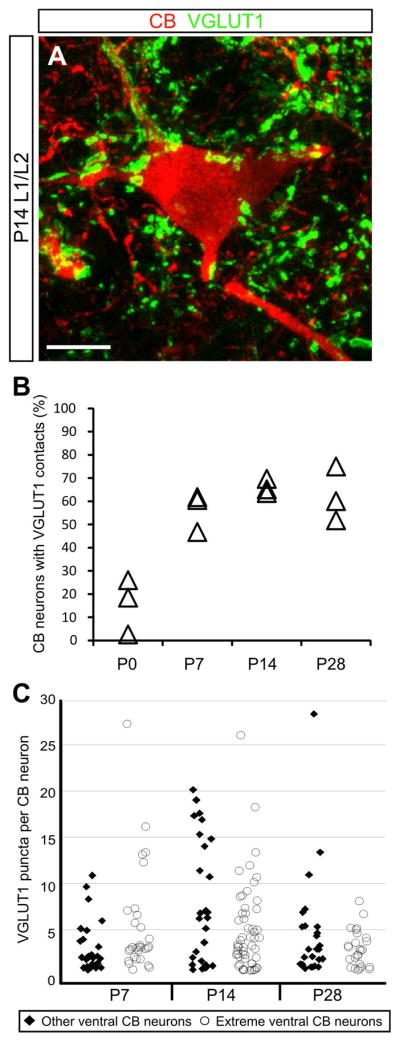
A subset of calbindin-expressing neurons receive putative synaptic contacts from primary sensory afferents. A: Representative image of a calbindin-expressing interneuron in the L1/L2 segment heavily contacted by VGLUT1 puncta, a putative marker of primary sensory afferent synapses. Image is a two-dimensional projection from a 24.3μm-thick confocal z-stack. Scale bar=10μm. B: Percent of analyzed calbindin neurons contacted by VGLUT1 puncta over postnatal development. The percent of all calbindin neurons receiving putative synaptic contacts are shown for three animals at each time point. C: Analyzed calbindin-expressing neurons were divided into two categories based on cell position: those found less than 100μm from the gray-white border in the ventral horn (extreme ventral CB neurons, open circles), and those whose position was greater than 100μm from the gray-white border (other ventral CB neurons, filled diamonds). Pooled data from three animals analyzed at each time point are plotted in C.
