
Figure 3.
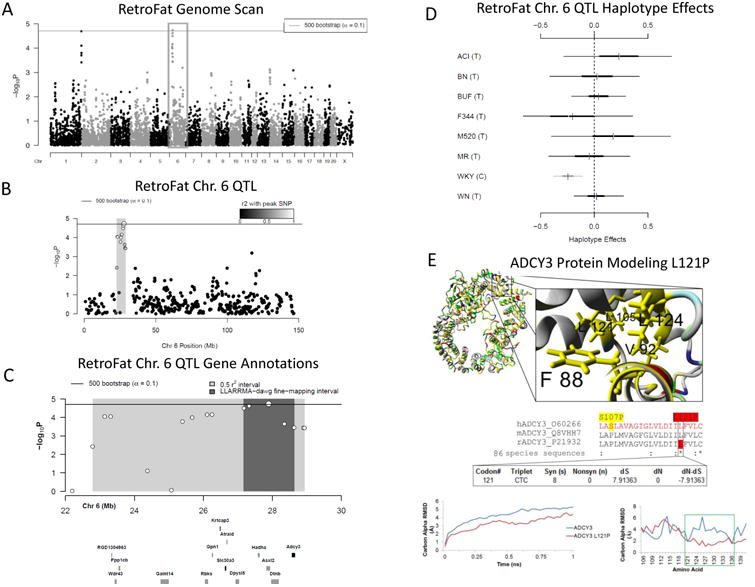
A) Genome scan of RetroFat. X-axis is position on chromosome and y-axis is the −logP level of association. Genome-wide significance thresholds were calculated using parametric bootstraps from the null model (α = 0.1, logP = 4.70). B) The grey region highlights the 6.14 LD support interval of the chromosome 6 QTL showing neighboring markers that are correlated with the peak marker, representing genomic regions likely to contain the causal variant underlying the statistical signal. C) Annotation of genes that fall within the support interval. The entire 6.14 region is shaded in grey, with the fine-mapped 1.46 Mb region shaded in dark grey. Only genes that have a cis eQTL are shown. All 130 genes within the region are listed in Supplementary Table S1. D) Additive haplotype effects were estimated using the Diploffect model, which takes into account uncertainty in haplotype state. SNP allele information is overlaid on the haplotype effects, and are distinguished by black or gray. The WKY haplotype, the only haplotype with the C allele at the chromosome 6 locus, has a significantly negative effect on phenotype. E) Protein modeling for ADCY3. Variant L121P of ADCY3 is found with the conserved hydrophobic core of the transmembrane helices. A zoomed in view is shown to the right. The middle panel shows sequence alignments of amino acids. ADCY3 amino acid 121 is also 100% conserved (red) as a leucine in 86 analyzed vertebrate species. A human SNP is known at amino acid 107 (yellow). Using the DNA information from the 86 nucleotide sequences for ADCY3, there is also evidence of selective pressure in the DNA sequence to conserve the amino acid. Bottom panel shows molecular dynamic simulations for ADCY3. Simulations performed on the protein dimer for wild type (WT blue) or the mutant (ADCY3 L121P, red) suggests that the models' average movement over time is altered. Altered movement is seen in the simulations for ADCY3 with fluctuation of amino acids found near amino acid 121 when mutated.