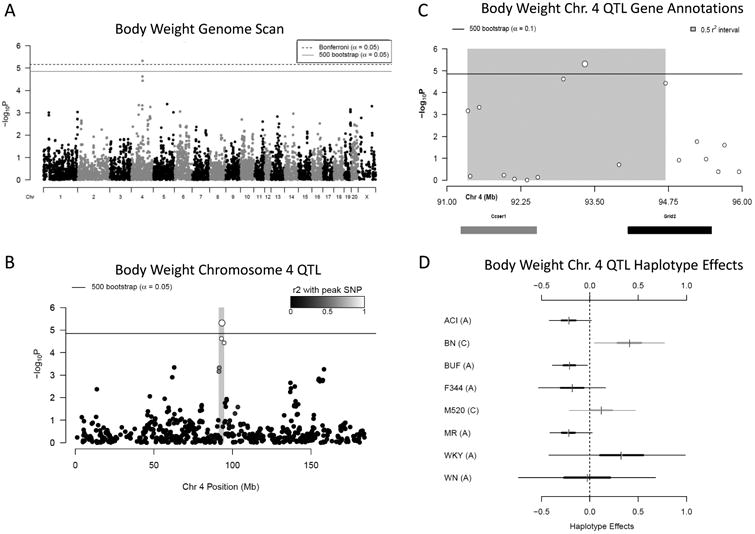
Figure 7.

A) Genome scan of body weight. X-axis is position on chromosome and y-axis is the −logP level of association. Genome-wide significance thresholds were calculated using parametric bootstraps from the null model (significant: α = 0.05, logP = 4.86) and conservative α = 0.05 Bonferroni thresholds (logP = 5.16). B) Linkage disequilibrium support interval in grey is 3.35 Mb. C) Annotation of the two characterized genes that fall within the support interval. D) Additive haplotype effects for chromosome 4 body weight QTL. The C allele at the marker could represent shared haplotype descent between BN and M520, both which have an increasing effect on body weight at this locus. ACI, BUF, F344 and MR haplotypes have a decreasing effect of body weight at this locus, all of which share the A allele. The WKY and WN also have an A allele and the WKY haplotype has an increasing effect on body weight, while the WN haplotype appears not to effect body weight, although the credible interval of both is fairly large and not well represented in the data at this locus.
