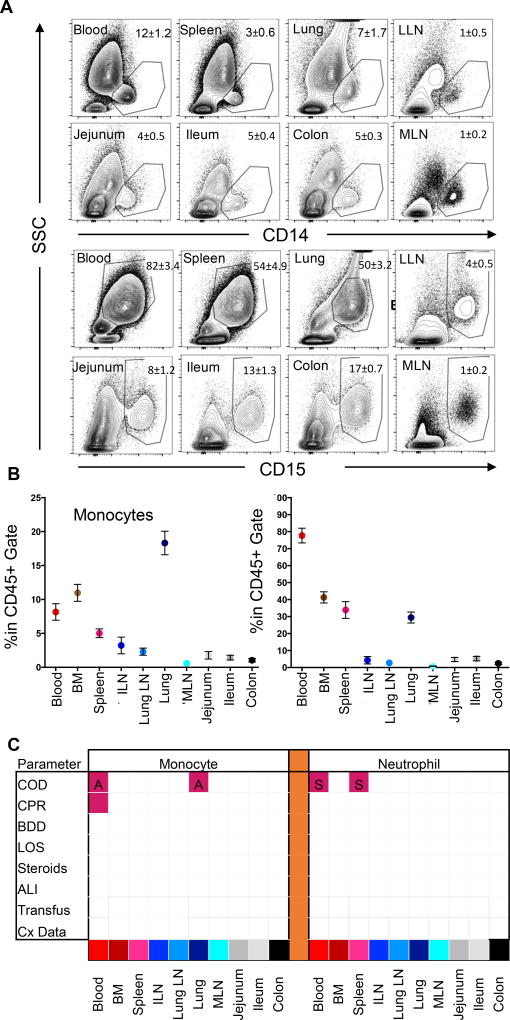
Figure 4. Low variability of Monocyte and neutrophil content as a function of donor clinical changes.
(A) Representative flow cytometry plots of CD14+ monocyte (first two rows) and CD15+ neutrophil (third and fourth rows) staining in relation to their side scatter properties in blood and seven tissue sites of a representative individual organ donor including blood, spleen, lung, lung-drining lymph nodes (LLN), jejunum, ileum, colon and mesenteric lymph node (MLN). Plots show profiles gated on live (DAPI−), singlet, CD45+ cells. Numbers in quadrants indicate mean ± SEM for entire cohort. (B) Compiled flow cytometry data showing percentage of monocytes (mean ± SEM) (left) and neutrophils (right) in blood and nine tissue sites (n=40). Tissue abbreviations as in (A) also showing bone marrow (BM) and iliac lymph node (ILN). (C) Matrix shows significant changes (p<0.05) in monocyte (left) or neutrophil (right) levels as a function of eight clinical factors as defined in Figure 1C (COD, cause of death; CPR, cardiopulmonary resuscitation; LOS, length of stay > 1 week; BDD, brain death duration greater than 48hrs; Transfusion; Cx Data) The matrix grid shows an ANOVA analysis analyzing the presence/absence of each factor in each tissue. Shaded pink boxes indicating significant (p<0.05) positive correlation with the factor and shaded blue boxes indicating negative correlation with the factor. Significance level for each factor was as follows: for monocytes, a higher frequency in the blood (p=0.0043) and lung (p<0.001) was associated with anoxia (labeled ‘A’) compared to donors who died of stroke, while higher monocyte frequency in blood was also associated with CPR (p=0.0293). For neutrophils, donors who died of stroke (labeled ‘S’) had significantly higher frequencies in the blood (p=0.0417) and spleen (p=0.0326) than donors who died of HT.

