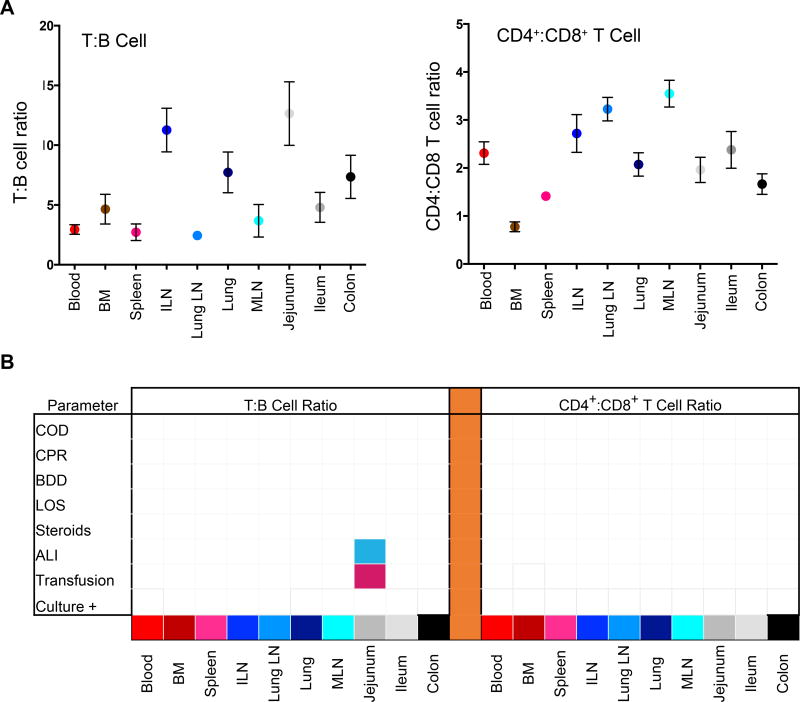
Figure 5. Stability of lymphocyte frequencies in donor blood and tissues as a function of donor clinical changes.
(A) Compiled Lymphocyte data showing mean ± SEM for T:B cell (left) and CD4+:CD8+ T cell (right) ratios in each tissue site (n=82). Tissue abbreviations: BM, bone marrow; ILN, iliac lymph node; MLN, mesenteric lymph node. (B) Matrices show significant changes (p<0.05) in T:B cell (left) or CD4+:CD8+ T cell (right) ratios as a function of eight measured clinical characteristics as defined in Figure 1C. The matrix grid shows an ANOVA analysis analyzing the presence/absence of each factor in each tissue. Shaded pink boxes indicating significant (p<0.05) positive correlation with the factor and shaded blue boxes indicating negative correlation with the factor. A lower T:B ratio in jejunum was associated with ALI (p<0.001) while a higher T:B cell ratio was associated with transfusions (p=0.0091).

