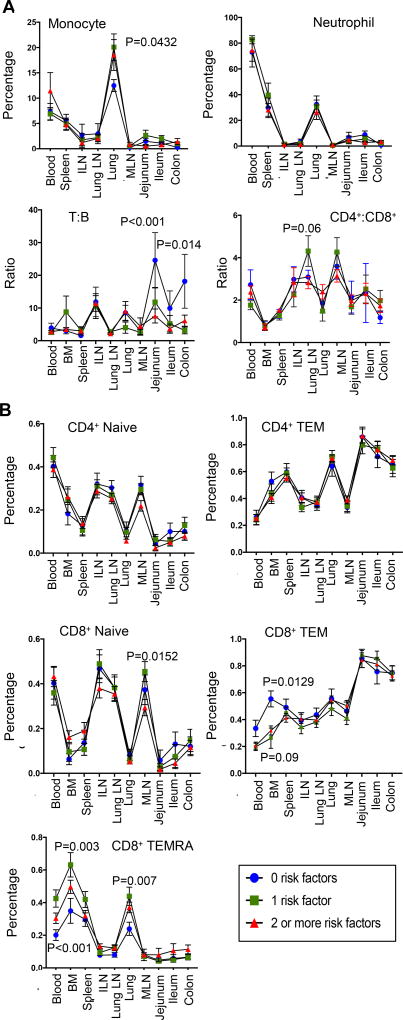
Figure 7. Immune cell variations for lymphoid and myeloid subsets across tissue site by number of donor clinical risk factors.
Cellular frequencies were compared between donors across three categories in all ten tissue sites: donor categories included, donors with 0 clinical risk factors; donors with one risk factor; and donors with two or more risk factors as defined in Figure 1C. (A) Monocyte/Neutrophil (n=40; top) as well as T:B and CD4+:CD8+ (n=82; bottom) ratios (mean value ± SEM) compared across tissue sites as a function of number of donor clinical risk factors. (B) CD4+ and CD8+ T cell subset frequencies compared across tissue sites as a function of number of donor clinical risk factors.

