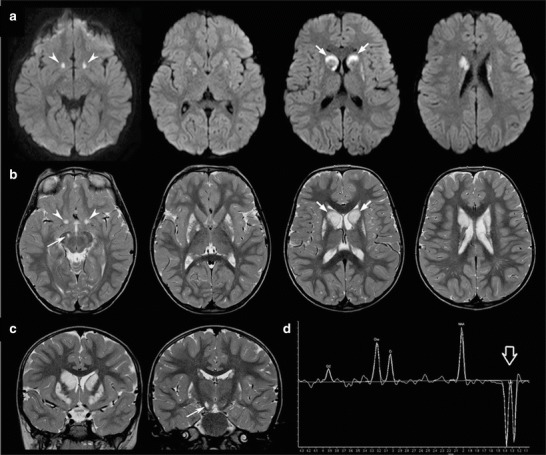
Fig. 2.

Follow-up brain MRI and MR spectroscopy performed at 3 years and 6 months. Axial diffusion-weighted images (a) and T2-weighted images (axial, b and coronal, c) reveal new acute lesions characterized by T2 hyperintensity and restricted diffusion due to cytotoxic edema at the level of the basal nuclei of Meynert (arrowheads), right cerebral peduncle (thin arrow), and caudate nuclei (arrows). Note the peculiar involvement of the heads of caudate nuclei, with prevalent restricted diffusion in the anterior peripheral portions and increased diffusion in the central portions. The putamina are markedly reduced in size with prevalent increased diffusion, in keeping with chronic evolution of the previous lesions. (d) The MR spectroscopy performed at the level of the right basal ganglia demonstrates slightly reduced NAA peak and markedly elevated lactate peak (empty arrow)
