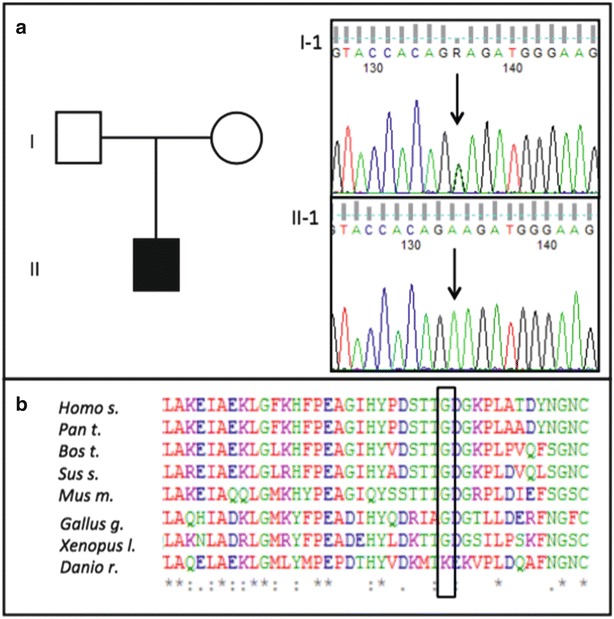
Fig. 3.

Molecular analysis of NDUFA10 gene. Electropherograms present the nucleotide change in fibroblasts of the patient (II-1); arrows point out the nucleotide substitution c.296G>A in exon 3 (a). Bottom figure show the high conservation of the altered amino acid (p.G99E) throughout evolution (b)
