
Fig. 3.
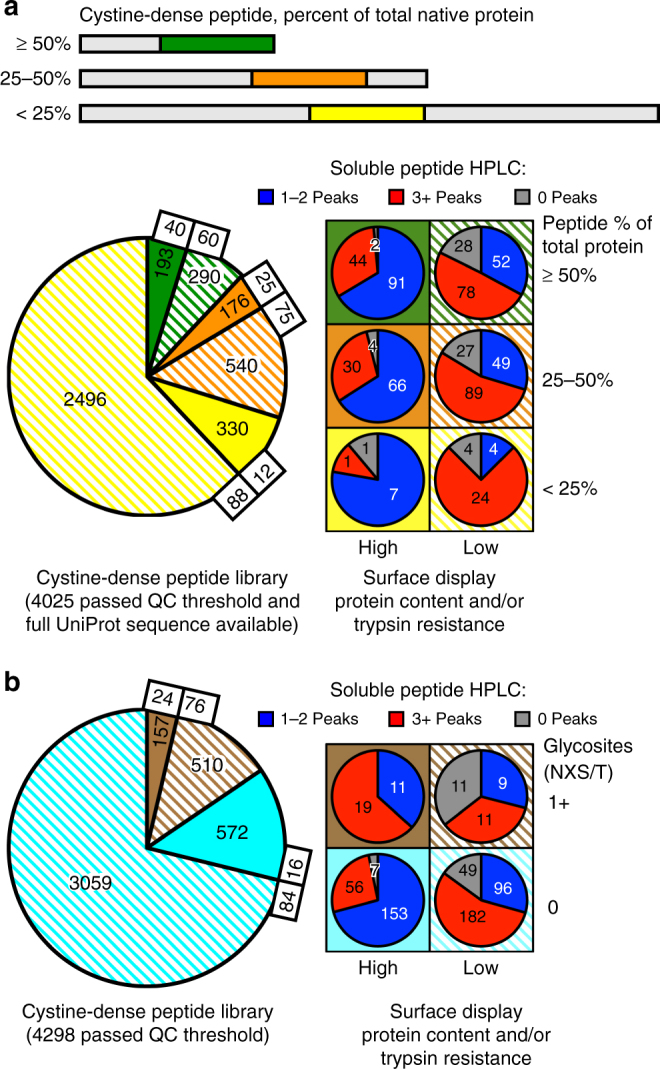
Effects of a CDP’s native protein context, and glycosylation, on surface and solution properties. a Categorizing the tested CDPs by the proportion of the native, full-length protein they represent, either < 25% (yellow), 25-50% (orange), or ≥ 50% (green). The measured surface display protein content/trypsin resistance properties (solid, high; dashed, low) and HPLC classification (1-2 Peaks, blue; 3+ Peaks, red; 0 Peaks, gray) are shown per category. Proportions of high content / trypsin resistant peptides are significantly different (P < 0.0001) between all categories. b Same analysis as in a, but categorized by the presence (brown) or absence (cyan) of canonical N-linked glycosites (NXS or NXT) within the peptide. The presence of a glycosite correlates with a significantly (P < 0.0001) higher probability of having high surface display protein content / trypsin resistance, but such high protein content / trypsin resistant, glycosite-containing peptides (solid brown) have significantly fewer (P < 0.0001) 1–2 Peak peptides than expected when compared to high protein content/trypsin resistant CDPs that lack NXS or NXT sites (solid cyan). Significance calculated by two-tailed Chi Square test