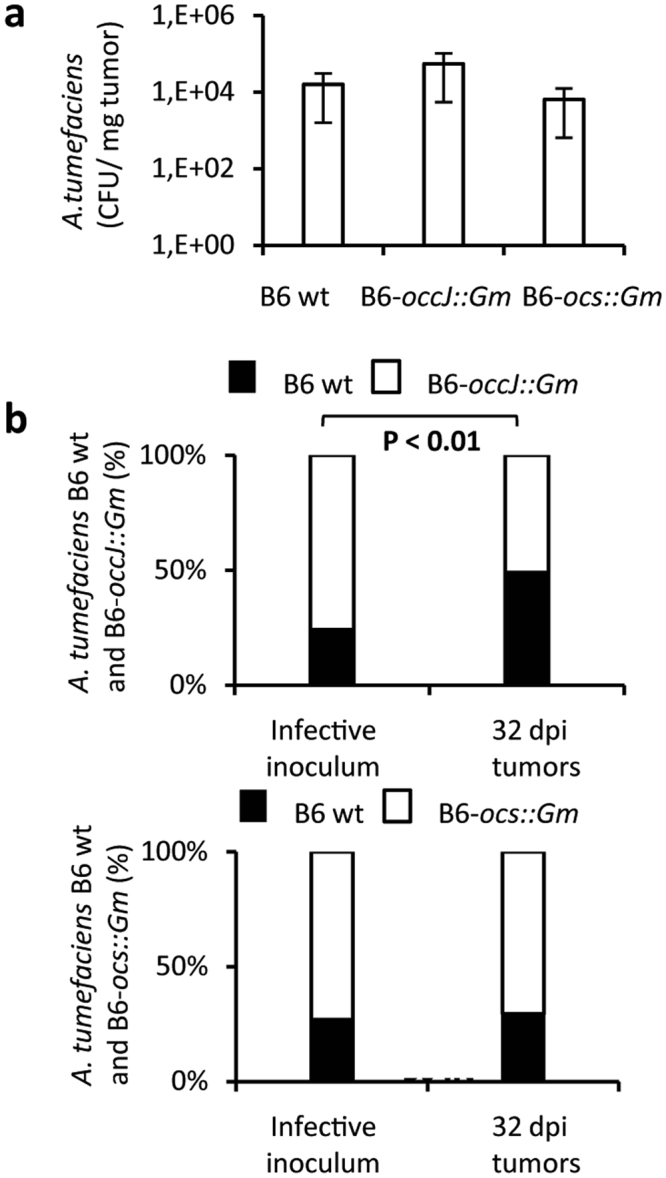
Figure 2.

OccJ confers a competitive advantage in plant tumor. (a) A. tumefaciens bacterial concentration (CFU/mg fresh weight tumor) in tomato tumor (at 32 dpi) infected with either A. tumefaciens WT B6 or B6-occJ::Gm or B6-ocs::Gm. (b) Proportion of A. tumefaciens genotypes (%) in inoculum and tomato tumor (at 32 dpi) infected with a mixture of A. tumefaciens WT B6 and B6-occJ::Gm (top graph) or A. tumefaciens WT B6 and B6-ocs::Gm (bottom graph). Fisher’s exact test was used for the comparison of genotype relative abundance in inoculum versus plant tumor. Values were collected from two independent experiments, each conditions involving from 5 to 7 plant tumors.
