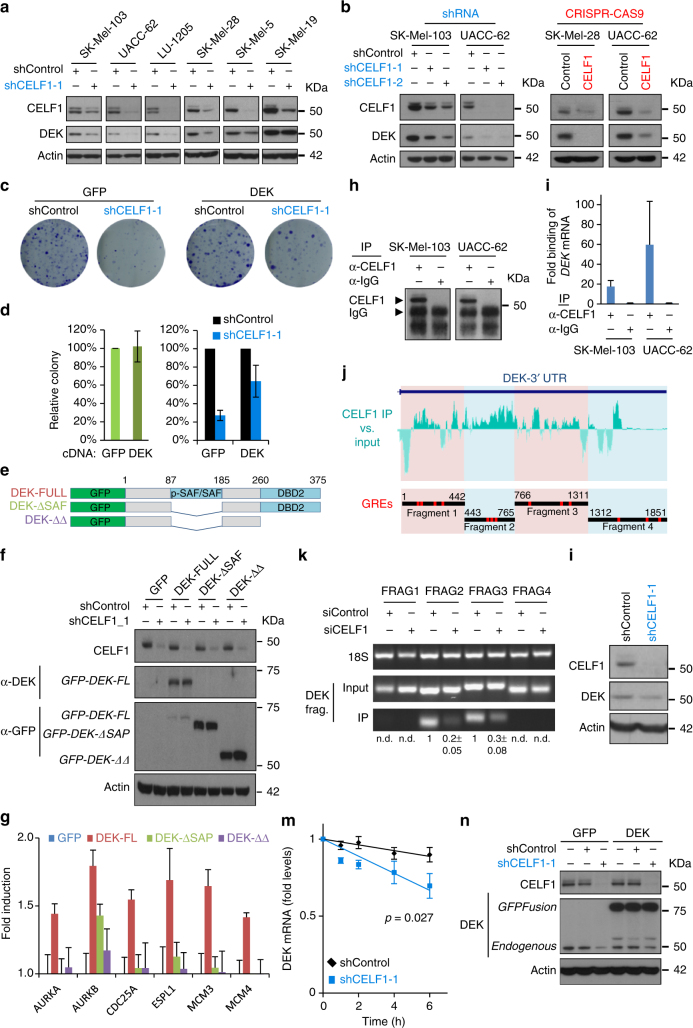
Fig. 6.
DEK is a bona fide CELF1 target. a CELF1 and DEK expression levels in indicated melanoma cell lines, detected by protein immnoblotting. b Immunoblots of the indicated cell populations to confirm DEK downregulation upon CELF1 depletion, for two shRNAs (blue) or CRISPR/Cas9 system (red). c Staining of colonies formed in the indicated cell populations transduced with full length DEK (or an empty GFP plasmid) and infected with control or shCELF1-1. d Quantification of data in c. Green bars represent the number of colonies of GFP vs. DEK in basal conditions. Those in the presence or absence of shCELF1 are shown in blue. Error bars correspond to SEM of three experiments. e Schematic representation of full length DEK and the GFP-tagged mutants to assess the impact of the DNA binding domain in the rescue of CELF1-depletion defects. f Expression levels of the different DEK constructs visualized with antibodies against GFP or the DEK central domain. g Differential impact of full length DEK vs. mutants to compensate for the inhibitory effect of CELF1 depletion. Data correspond to mRNA expression by qPCR represented relative to GFP or indicated DEK constructs infected CELF1-depleted cells. Error bars correspond to SEM of three independent experiments in triplicate. h CELF1 immunoprecipitation for subsequent qPCR-based validation of binding to DEK 3′ UTR, as quantified in i. Error bars correspond to SEM of two experiments. j Upper, histogram of RIP-Seq peak calling from identifying CELF1 binding enrichment at the 3′ UTR of the DEK mRNA, relative to input controls. Bottom panel, DEK 3′ UTR fragments cloned into lentiviral vectors to define CELF1 recognition. GREs are labeled in red. k Amplification of DEK 3′ UTR fragments after CELF1 RNA-IP, determined by semiqRT-PCR. l Protein depletion efficiency of shCELF1-1 shown by protein immunoblots compared to shControl induced UACC-62 cells. m DEK mRNA levels after actinomycin D treatment in indicated UACC-62 populations expressed as a function of time. Error bars correspond to SEM of three experiments in triplicate. n Transduction of UACC-62 melanoma cells with GFP or GFP-DEK cDNA (i.e., lacking 3′ UTR) for subsequent transduction of control or CELF1 shRNA, followed by protein immunoblotting

