Figure 2.
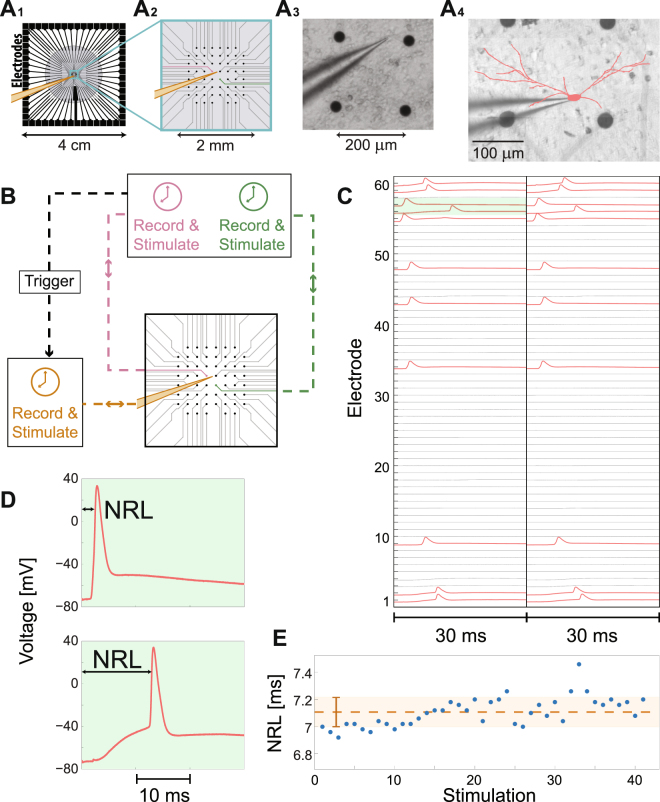
The Experimental Setup and Principles of Measurements. (A) A micro-electrode array (MEA) consisting of 60 electrodes (see Methods for details). (A1) The gray circle with a diameter of ~2.2 cm represents the tissue culture area of ~1.3 million cortical neurons (Methods). (A2) Zoom-in of the blue square in (A1) showing the arrangement of the 60 extracellular electrodes, separated by 200 µm. A patched neuron, indicated by a yellow intracellular electrode, and two nearby extracellular electrodes (pink and green) are demonstrated. (A3) A snapshot of a section of a neuronal culture with an intracellular patch electrode and four extracellular electrodes, similar to (A2), allowing simultaneously recording and multiple stimulations. (A4) A reconstruction of a fluorescence image (Methods) of a patched neuron and its dendrites (red), growing to different directions. The typical distance to the nearest extracellular electrode (black circles) is much less than 100 µm. (B) A simplified scheme of the experimental setup according to A2 (see Methods and Supplementary Fig. S1 for more details). The extracellular and the intracellular electrodes are capable of recording and stimulating simultaneously in a time resolution of 20 μs using their controlled unit (color-coded). A trigger from the extracellular electrodes to the control unit of the intracellular electrode is used to synchronize their clocks. (C) An example of the developed experimental method for finding a subset of extracellular electrodes which reliably generate evoked spikes measured by the intracellular electrode. The 60 extracellular electrodes are stimulated serially at 2 Hz and above-threshold, where each electrode is stimulated several times (twice in this demonstration) and the voltage of the first 30 ms after each stimulation is presented. Red electrodes in the raster plot indicate electrodes which result in reliable evoked spikes. (D) A zoom-in of the green area in (C), presenting evoked spikes originated from 2 different extracellular stimulating electrodes. The neuronal response latency (NRL), measuring the time-lag between the extracellular stimulation and the intracellularly recorded evoked spike (measured following threshold crossing, see Methods), is exemplified. The NRL of the same neuron varies among extracellular stimulating electrodes; however, for a given stimulating electrode it is reproducible (for low stimulation frequencies), as can be qualitatively seen in (C). (E) The stability of the NRL is quantitatively demonstrated for 40 consecutive stimulations from a given electrode at 1 Hz. The orange dashed line represents the average NRL, and the orange bar (and light-orange area) represents the standard deviation, ~0.1 ms. See also Supplementary Fig. S1.

