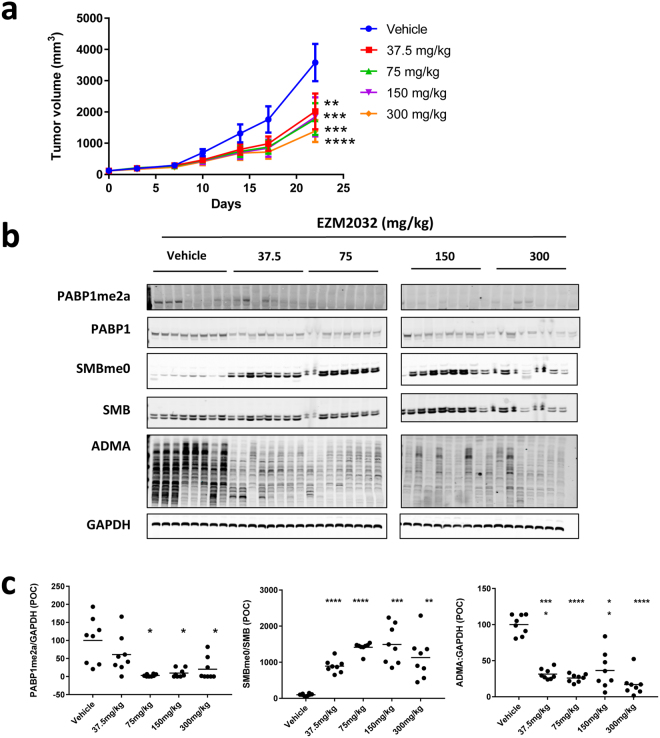
Figure 5.
EZM2302 shows dose dependent target engagement and tumor growth inhibition in vivo. (a) Anti-tumor activity in RPMI-8226 xenograft model induced by twice daily (BID) administration of EZM2302 for 21 days at the indicated doses (N = 8, Mean value ± SEM). Tumor growth rates were significantly reduced at all dose groups (*p < 0.05, **p < 0.01, ***p < 0.001, ****p < 0.0001, versus vehicle, 2-way ANOVA with a Dunnett’s post-test). P values compared to vehicle were: 37.5 mg/kg p = 0.004, 75 mg/kg p = 0.0008, 150 mg/kg p = 0.007, 300 mg/kg p = 0.0001. Compound administration was stopped on day 21, and tumors were harvested for PD analysis. (b) CARM1 target inhibition in RPMI-8226 xenograft tumor tissue collected from mice euthanized after 21 days of BID dosing. (c) Each point represents the ratio of PABP1me2a to GAPDH, aDMA to GAPDH, or SmBme0 to SmB normalized to the vehicle control, measured by WB. Dose groups that showed a statistically significant inhibition are indicated (*p < 0.05, **p < 0.01, ***p < 0.001, ****p < 0.0001, versus vehicle, 1-way ANOVA with a Dunnett’s post-test). P values compared to vehicle were: PABP1me2a: 37.5 mg/kg p = 0.603, 75 mg/kg p = 0.011, 150 mg/kg p = 0.020, 300 mg/kg p = 0.036, SMBme0: 37.5 mg/kg p = 0.0001, 75 mg/kg p = 0.0001, 150 mg/kg p = 0.0004, 300 mg/kg p = 0.005, ADMA: 37.5 mg/kg p = 0.0001, 75 mg/kg p = 0.0001, 150 mg/kg p = 0.0021, 300 mg/kg p = 0.0001. Images in (b) have been cropped. Uncropped images are presented in Supplementary Fig. S11.

