
Figure 1.
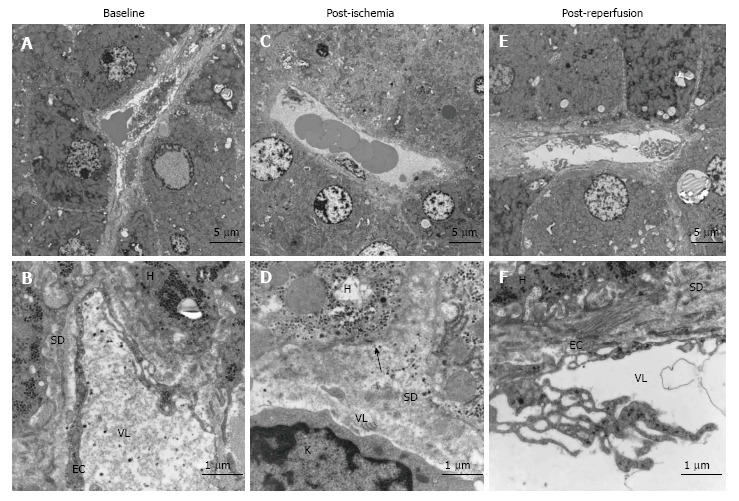
Morphological changes in liver before and after ischemia and reperfusion, transmission electron micrographs of representative images of liver sections from one patient. A: Baseline, before induction of ischemia, shows the normal state of liver morphology at a cellular level; B: Morphology of a sinusoid with neighbouring hepatocytes 20 min after ischemia; C: Representative image of sinusoid and haptocytes 20 min after reperfusion; D: Endothelial lining of a sinusoid with hepatocyte microvilli; E: Morphology of the Space of Disse post-ischemia; F: Morphology of the space of disse post-reperfusion. SD: Space of disse; H: Hepatocyte; EC: Endothelial cells; VL: Vessel lumen; K: Kupffer cell. Arrow shows the absence of hepatocyte microvilli.