
Figure 2.
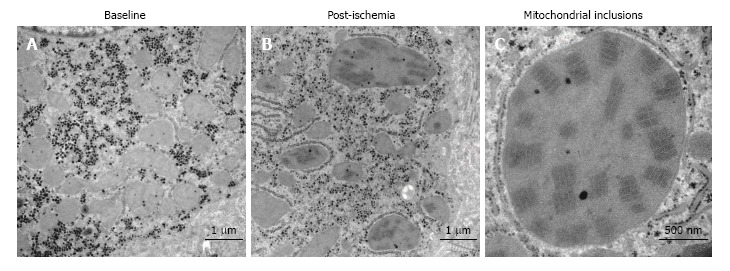
Crystalline mitochondrial inclusions. A: Baseline, before induction of ischemia, shows hepatocyte mitochondria with normal appearance; B: Post-ischemia, showing mitochondria with the crystalline inclusions and a few dilated mitochondria; C: Mitochondrial inclusions, close-up of a single mega-mitochondrion showing the inclusions post-ischemia.