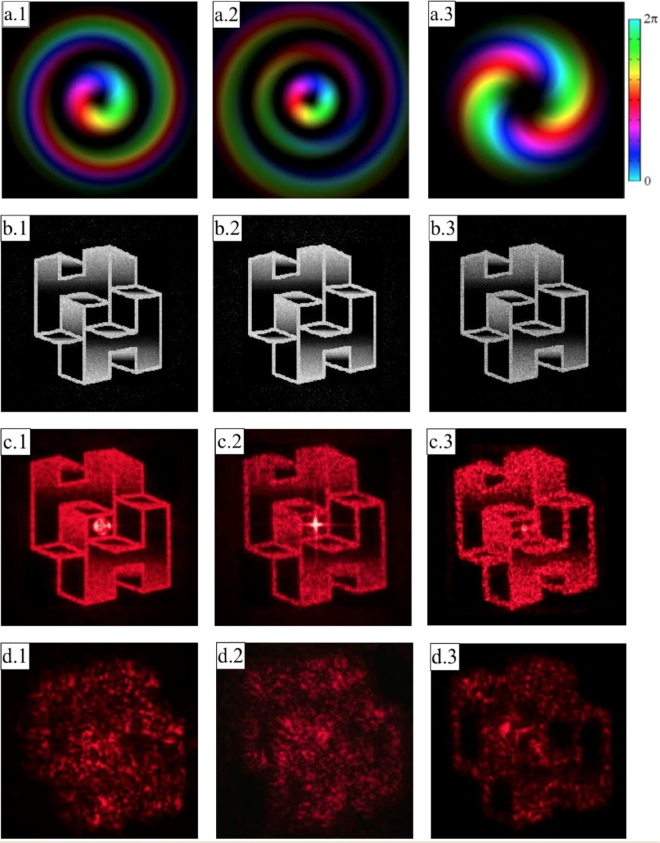
Figure 7.
(a) Experimental beam generated with SPPs for p = 1, ℓ = +1 (a.1), p = 2, ℓ = +1 (a.2), p = 0, ℓ = +2 (a.3). Brightness and colours refer to intensity (experimental) and phase (theoretical) respectively. (b) Simulated image for correct illumination with p = 1, ℓ = +1 (b.1), p = 2, ℓ = +1 (b.2), p = 0, ℓ = +2 (b.3). (c) Experimental output in case of correct illumination with p = 1, ℓ = + 1 (c.1), p = 2, ℓ = +1 (c.2), p = 0, ℓ = +2 (c.3) or wrong Gaussian illumination p = 0, ℓ = 0 (d.1, d.2, d.3).

