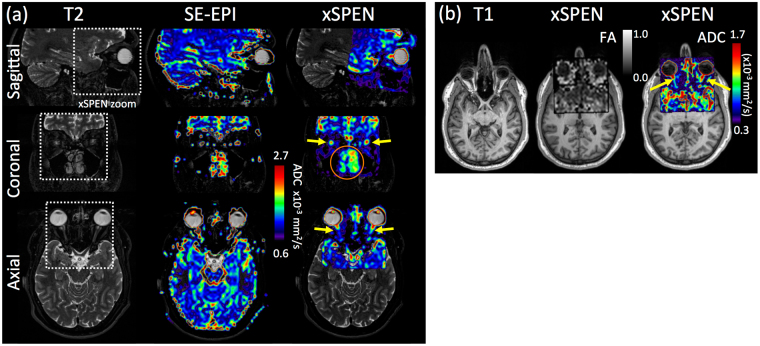
Figure 6.
Zoomed-in xSPEN diffusion data arising from a human frontal lobe (dashed square regions) containing the optic nerve indicated by the yellow arrows. (a) SE-EPI and xSPEN ADC maps overlaid on T2-weighted anatomical images, showing the optic nerve in three different orientations. Notice the regions missing in the EPI maps owing to susceptibility distortions, including the nasal cavity (orange circle). (b) FA and ADC maps obtained with xSPEN zooms that were slightly tilted to better align along the optic nerve, overlaid on anatomical T1-weighted images. The ADC scale has been adapted to highlight the nerves. In all cases the xSPEN axis run along the anterior-posterior direction; see Methods for additional scanning parameters.

