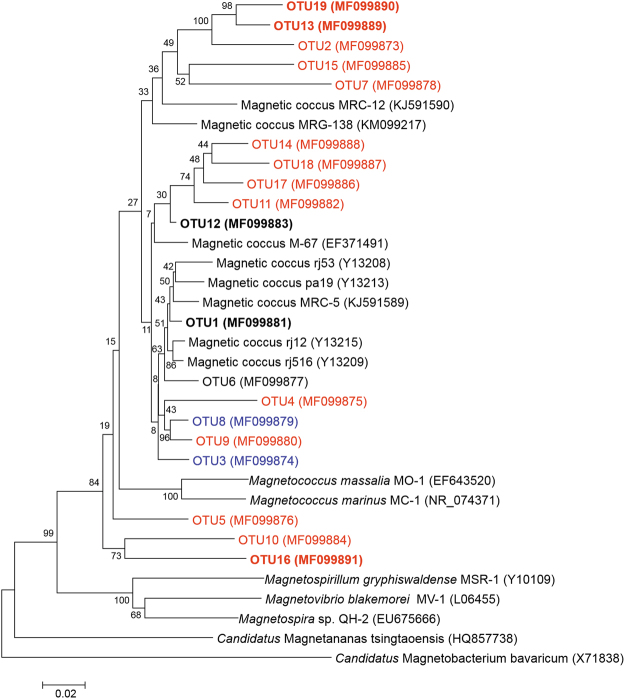
Figure 5.
Phylogenetic tree based on 16S rRNA gene sequences for the 19 MTB OTUs identified from live MTB samples. The phylogenetic tree was constructed based on neighbor-joining analysis. Bootstrap values at the nodes are percentages of 1,000 replicates. We used 97% and 95% sequence identity as the thresholds for classifying to species and genus levels, respectively. OTUs belonging to new species are indicated in blue. OTUs belonging to new genera are indicated in red. OTUs identified from micromanipulated samples are emphasized in bold characters. The scale bar indicates 2% sequence divergence.

