
Figure 3.
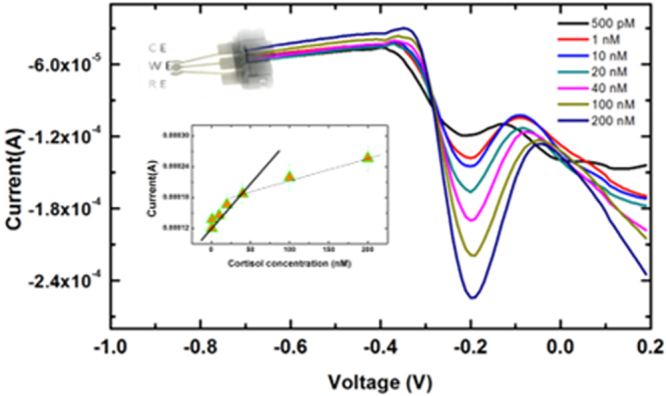
Differential pulse voltammograms at MWNT-Cu-PP-MNP-AptC for different cortisol concentrations in 0.1 M KCl, 10 mM phosphate buffer (pH 7.0) (a–f: 500 pM, 1, 10, 20, 40, 100, 200 nM) Inset: Cortisol concentration vs Output current.
Official websites use .gov
A
.gov website belongs to an official
government organization in the United States.
Secure .gov websites use HTTPS
A lock (
) or https:// means you've safely
connected to the .gov website. Share sensitive
information only on official, secure websites.
Differential pulse voltammograms at MWNT-Cu-PP-MNP-AptC for different cortisol concentrations in 0.1 M KCl, 10 mM phosphate buffer (pH 7.0) (a–f: 500 pM, 1, 10, 20, 40, 100, 200 nM) Inset: Cortisol concentration vs Output current.