Figure 6.
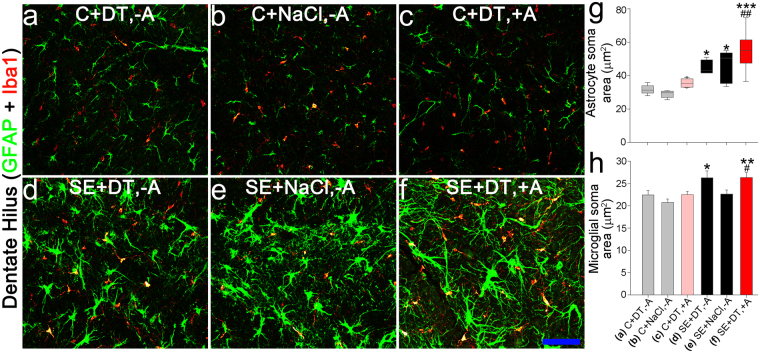
Confocal maximum projections of the dentate hilus showing immunostaining for microglial (Iba1, red) and astrocytic (GFAP, green) markers. (a) Healthy-control that received diphtheria toxin but lacked the receptor, so ablation did not occur (C + DT, −A). (b) Healthy-control that expressed the diphtheria toxin receptor, but received saline, so ablation did not occur (C + NaCl, −A). (c) Healthy-ablation, expressing the receptor and receiving toxin (C + DT, + A). (d) SE-control that received toxin but lacked the receptor (SE + DT, −A). (e) SE-control that expressed the diphtheria toxin receptor, but received saline (SE + NaCl, −A). (f) SE-ablation, expressing the receptor and receiving toxin (SE + DT, + A). Scale bar = 50 µm. (g) Graph showing the average soma area for GFAP immunopositive astrocytes. Status epilepticus was associated with increased astrocyte soma area. ***p < 0.001 vs. Group B. *p < 0.05 vs. Group B. ##p < 0.01 vs. Group A. (h) Graph detailing the average soma area for Iba1 positive microglia cells within each treatment group. Status epilepticus (SE) was associated with increased microglial soma area. **p < 0.01 vs. Group B. *p < 0.05 vs. Group B. #p < 0.05 vs Group C. See Table 1 for group details.

