Fig. 1.
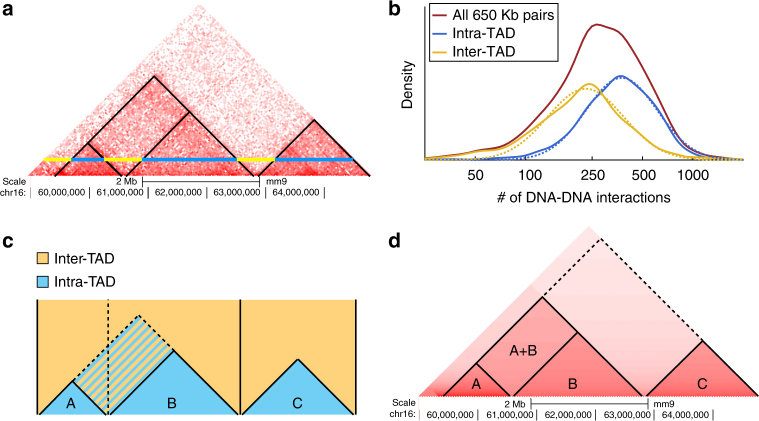
Overview of the PSYCHIC algorithm. a Example of Hi-C interaction map (rotated in 45°), from mouse cortex (chr16, 59–65 Mb)25. Blue and yellow horizontal lines correspond to DNA–DNA pairs, 650 Kb apart, within and across domains. b Histograms show the empirical abundance of these DNA–DNA interactions, either within domains (blue) or across domains (yellow), and demonstrate the enrichment of intra-TAD interactions. Dotted lines show a log-Normal distribution fitted to these empirical data. c. PSYCHIC first uses a two-component probabilistic mixture model to estimate the number of intra-TAD (blue) and inter-TAD (yellow) DNA–DNA interactions. For example, shown is segmentation into three domains A–C (delineated by vertical lines). An alternative segmentation, where A and B domains are unified now consider the striped rectangle as intra-TAD. PSYCHIC uses a log-posterior ratio score with a Dynamic Programming algorithm to identify the optimal (Viterbi) segmentation of the chromosome into domains. d. PSYCHIC then iteratively merges similar neighboring domains (here, A + B) into hierarchical structures. For example, dotted lines marks a possible 2nd–order merge between the merged (A + B) domain and domain C. PSYCHIC then fits a bi-linear power-law model for each TAD or merge to reconstruct a domain-specific background model (shown by different shades of red). This allows for the identification of over-represented DNA–DNA pairs, including putative promoter–enhancer interactions

