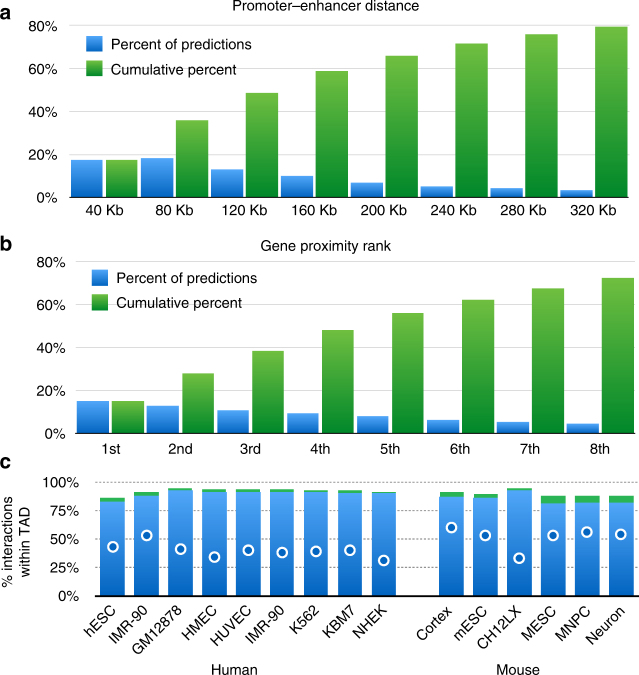
Fig. 4.
Promoter–enhancers interactions. a. Distribution (blue) and cumulative distribution (green) of promoter–enhancer interactions for mouse cortex data25, as predicted form PSYCHIC (FDR < 1e-2). b Same as (A), reporting the proximity rank of genes associated with predicted enhancer bins. c Most putative enhancers reside within the same TAD as their targets. For each of the 15 human and mouse Hi-C experiments analyzed, the Y-axis shows the percent of predicted DNA–DNA pairs to fall within the same topological domain. Green supplements show the percent of additional pairs falling within 1st level of TAD–TAD hierarchical merges. Blue dots show percent of “random” enhancers residing within the same TAD

