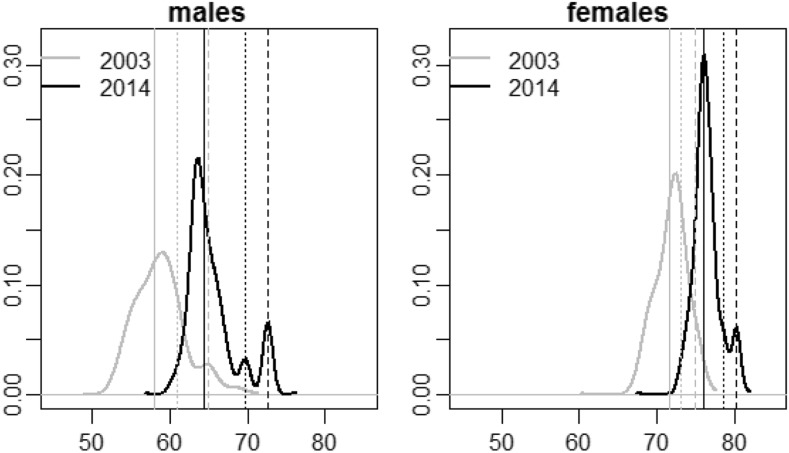
Fig. 4.
Distributions of life expectancies at birth across Russian regions. Note: The vertical solid lines indicate the value of life expectancy in Russia, excluding the cities of Moscow and Saint Petersburg; dashed lines—in the city of Moscow; dotted lines—in the city of Saint Petersburg.
Source: Own calculation based on data provided by Rosstat

