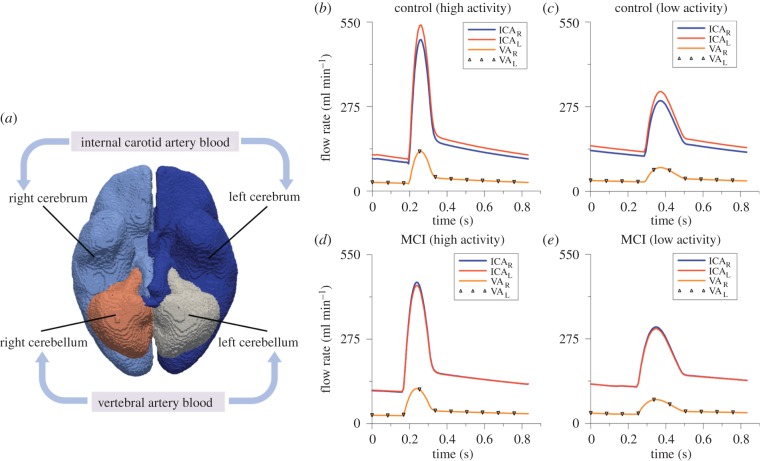
Figure 12.
(a) The four regions on the cortical surface that are used for the personalized BCs of arterial blood flow. (b) A snapshot of the waveforms of left and right ICA and VA flow profiles corresponding to the period of high activity within a 24 h period for the control subject, (c) low activity for the control subject, (d) for high activity for the MCI subject and (e) for low activity for the MCI subject. (Online version in colour.)

