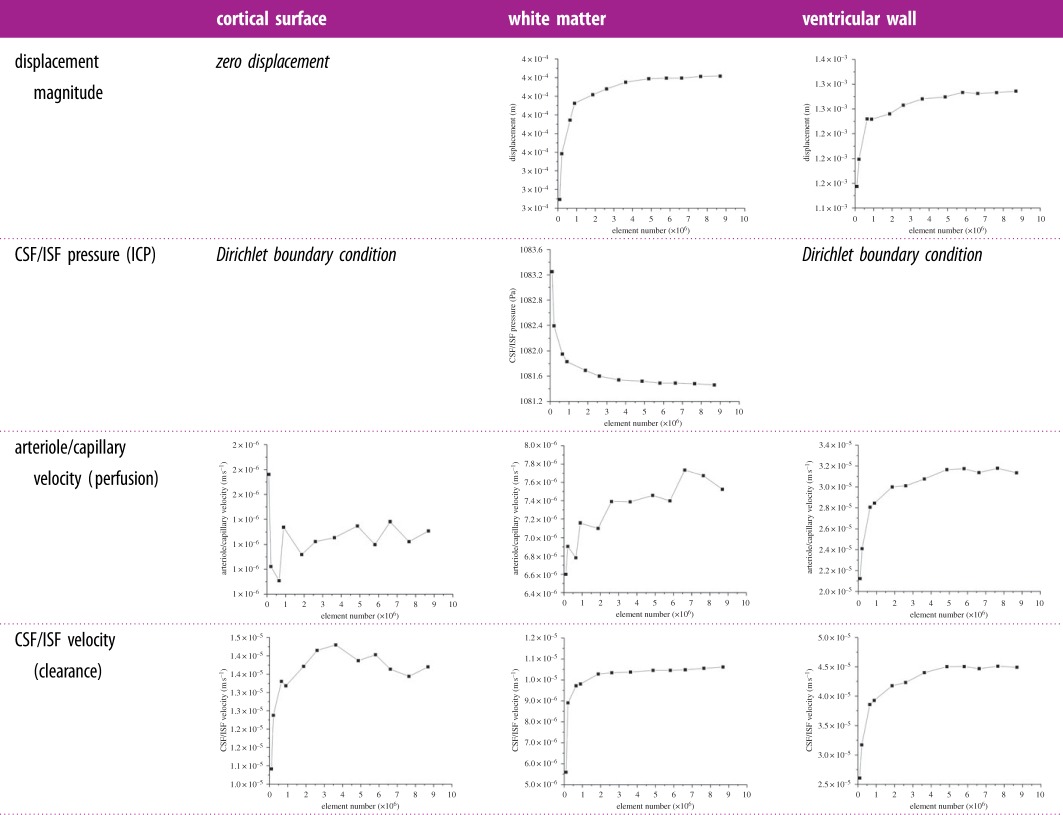
Table 3.
Convergence plots as element number increases at different positions in the parenchymal domain. It should be noted that there are Dirichlet BCs applied for certain variables, so the values do not change as the element number increases and their plots are not included here.
 |
