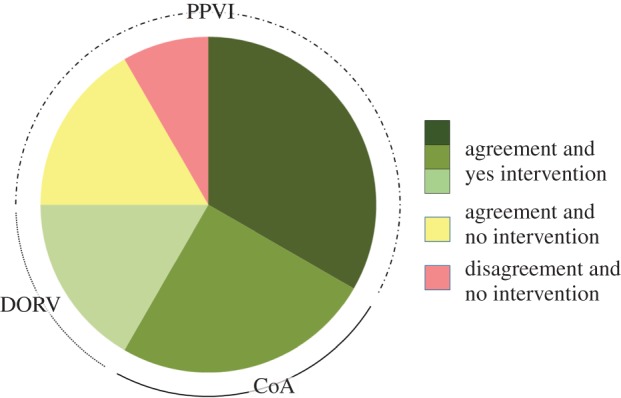
Figure 2.

The pie chart summarizes the agreement between simulations and procedural decisions of the cases included in this study: in nine cases (green), there was agreement between simulation results and clinical decisions, and the planned intervention was performed; in two cases (yellow), there was agreement between simulation results and clinical decisions, and the planned intervention was not performed; in one case (red), there was disagreement between simulation results and clinical decisions, and the planned intervention was not performed. (Online version in colour.)
